






63 CTR Statistics 2026: Average Click-Through Rates by Channel
CTR benchmarks for each channel vary from study to study. So you might be wondering: what is the actual average CTR in digital marketing?
To answer that question and make your life easier, we collected 63 studies and calculated the average click-through rate for each major marketing channel.
Average click-through rate (CTR): Quick summary by channel
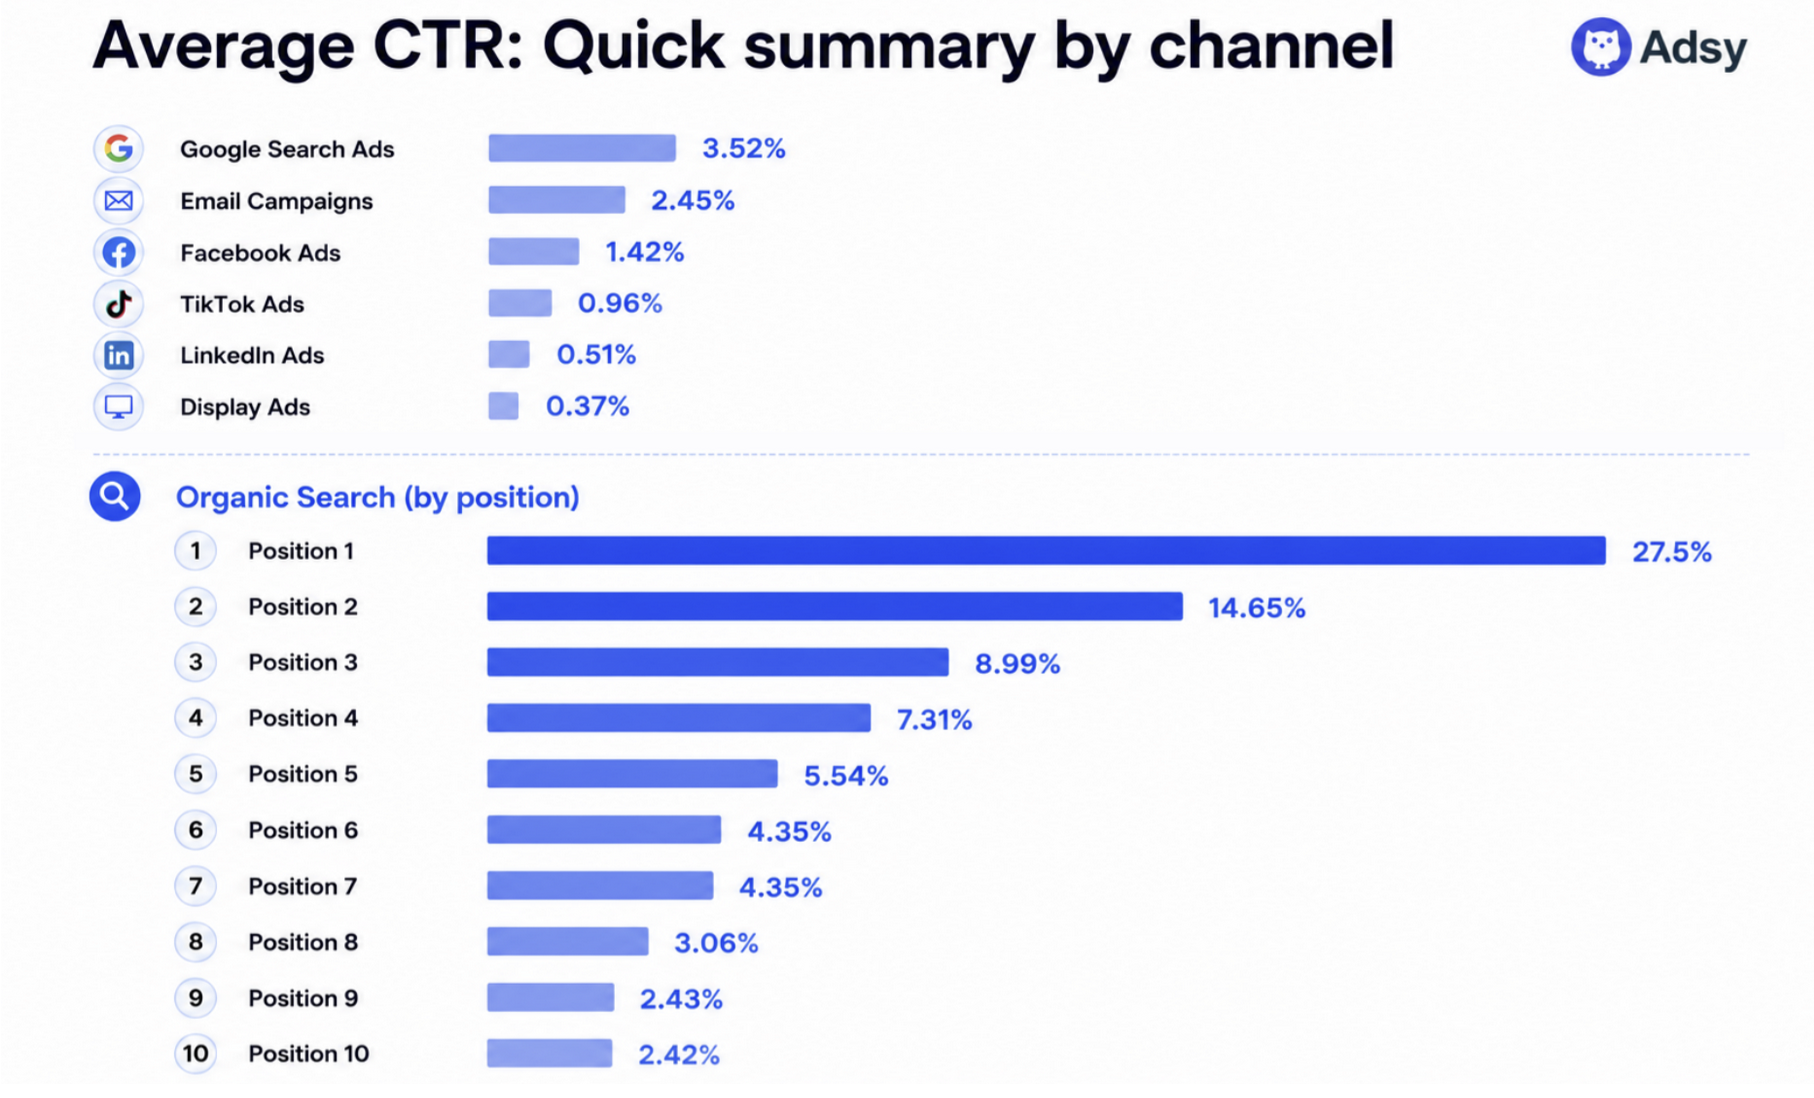
- Google Search Ads: 3.52%
- Display Ads: 0.37%
- Email Campaigns: 2.45%
- Facebook Ads: 1.42%
- LinkedIn Ads: 0.51%
- TikTok Ads: 0.96%
- Organic Search: Position 1 – 27.5%; Position 2 – 14.65%; Position 3 – 8.99%; Position 4 – 7.31%; Position 5 – 5.54%; Position 6 – 4.35%; Position 7 – 4.25%; Position 8 – 3.06%; Position 9 – 2.43%; Position 10 – 2.42%.
Why this list?
We created this list because we know how confusing it can be to find average CTR.
Every study seems to show different numbers.
So, which one should you use?
This was the question we were asking ourselves, too. That’s exactly why we gathered available credible benchmark studies in one place and calculated their average.
Google Ads CTR benchmarks
Average Google Ads CTR: 3.52%
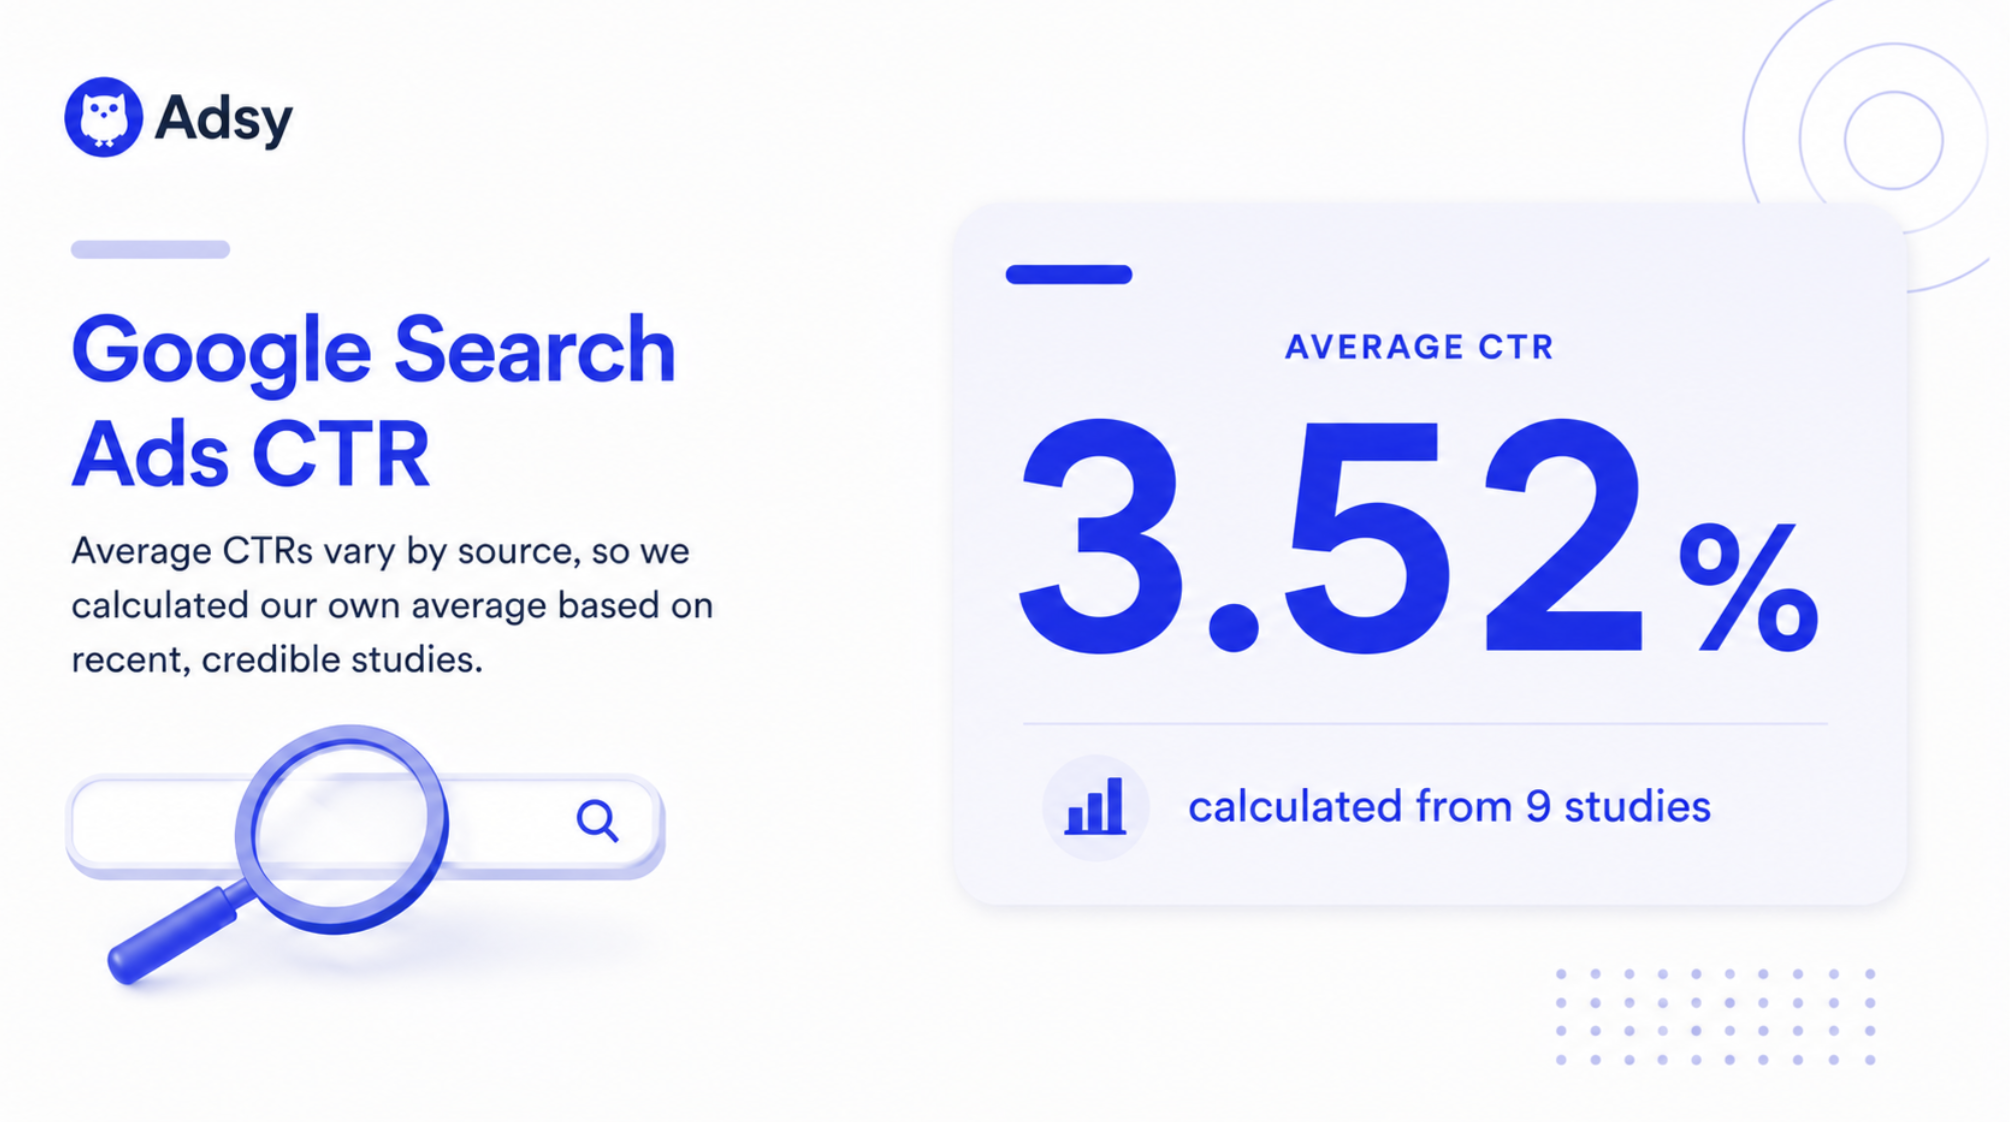
These are the CTR benchmark studies we used to calculate the average:
- 3.17% Store Growers (updated February 12, 2026)
- 4.00%WebFX (updated May 14, 2026)
- 2.41%Search Engine Land (updated April 8, 2025)
- 4.99%AgencyAnalytics (updated March 20, 2025)
- 3.80%SearchLab (updated January 13, 2026)
- 3.17%WordStream(updated May 27, 2026)
- 3.52%Digital Applied (April 5, 2026)
- 3.17%KreativaGroup (April 8, 2026)
- 3.41%GetRyze (updated June 12, 2026)
Average CTR for display ads
Average display ads CTR: 0.37%
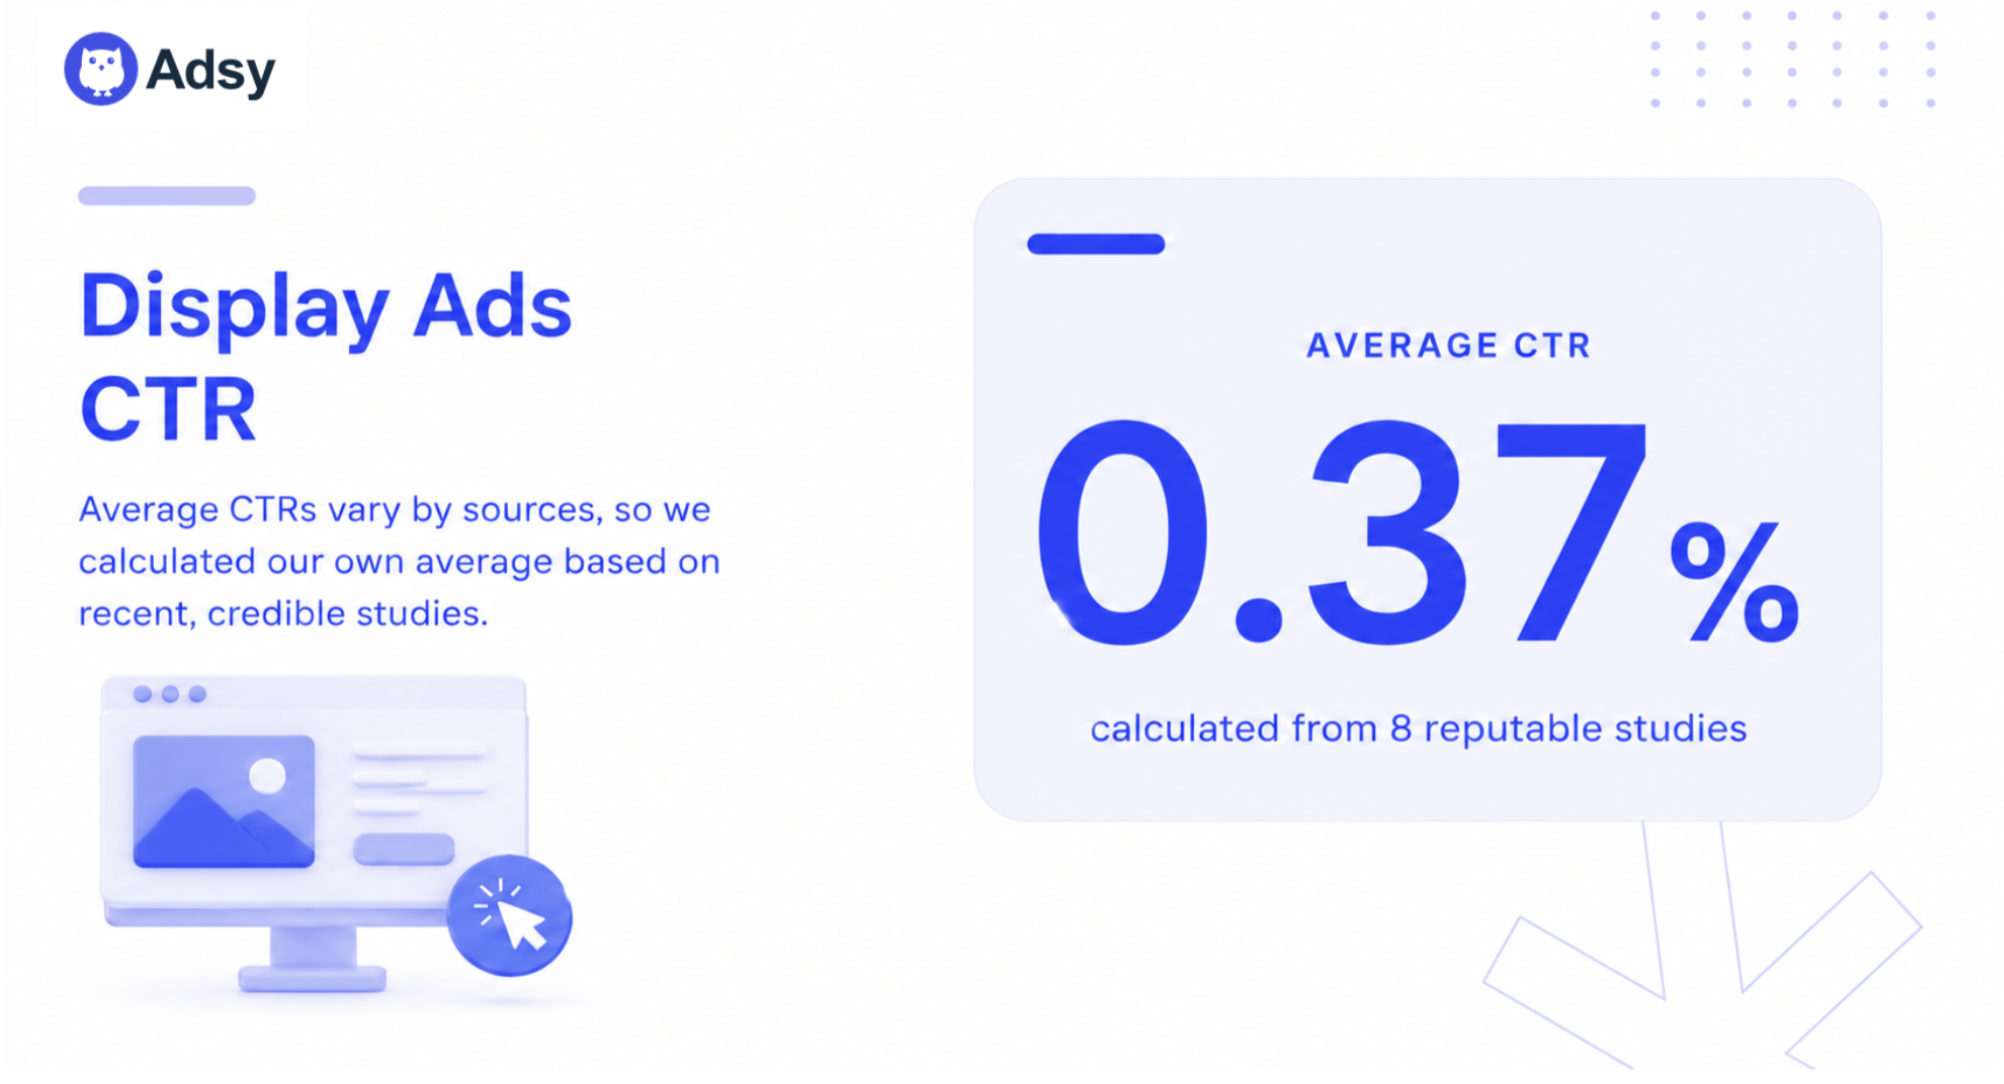
These are the CTR benchmark studies we used to calculate the average:
- 0.46% WordStream (updated February 29, 2016)
- 0.27% Search Engine Land (updated March 2025)
- 0.10% Bannerflow (updated 2024)
- 0.46% ContentMation (updated 2025)
- 0.46% Digital Applied (updated January 2026)
- 0.57% AdBacklog (updated 2025)
- 0.35% AllMediaDesk (updated 2024)
- 0.30% Search Engine Land (updated 2025)
Note: CTR can also depend on display format.
Email CTR benchmarks
Average email CTR: 2.45%
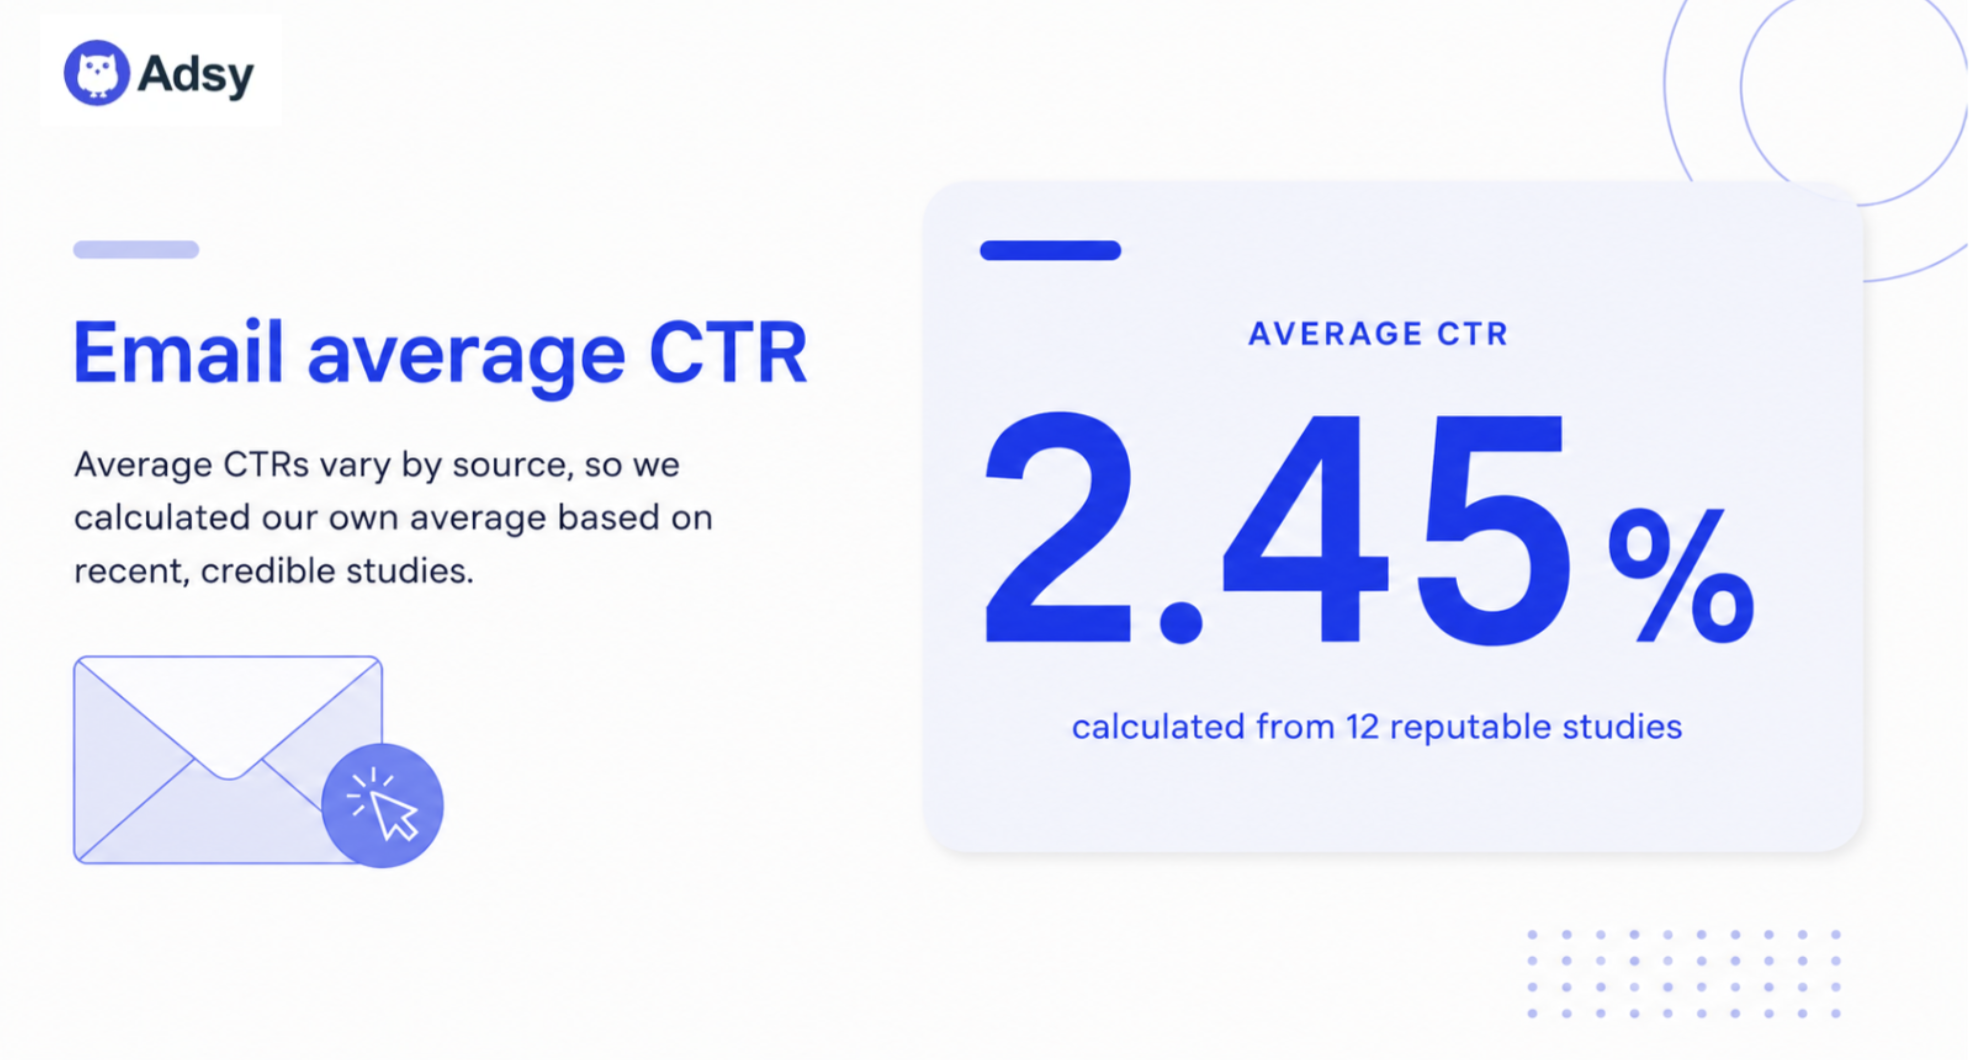
Below is a list of studies we used to calculate the average:
- 4.48% Twilio SendGrid (updated 2023)
- 2.30% Visionary Marketing (updated 2026)
- 1.40% ConstantContract (updated 2025)
- 2.62% Mailchimp (updated 2025)
- 2.09% MailerLite (updated 2025)
- 3.25% GetResponse (updated 2025)
- 2.27% Brevo (updated 2026)
- 1.69% Klaviyo (updated 2026)
- 2.30% Campaign Monitor (2021)
- 0.74% Omnisend (2025)
- 3.70% Dotdigital (updated 2025)
- 2.60% HubSpot (updated 2025)
Note: CTR can also depend on the type of email campaign.
Paid social media CTR benchmarks
CTRs for paid social media can vary across platforms.
Facebook, LinkedIn, and TikTok often have different average CTRs. As these platforms have different content formats, user behaviors, etc.
Let’s take a look at the average CTRs for each of these three platforms:
Facebook Ads
Average CTR for Facebook Ads: 1.42%
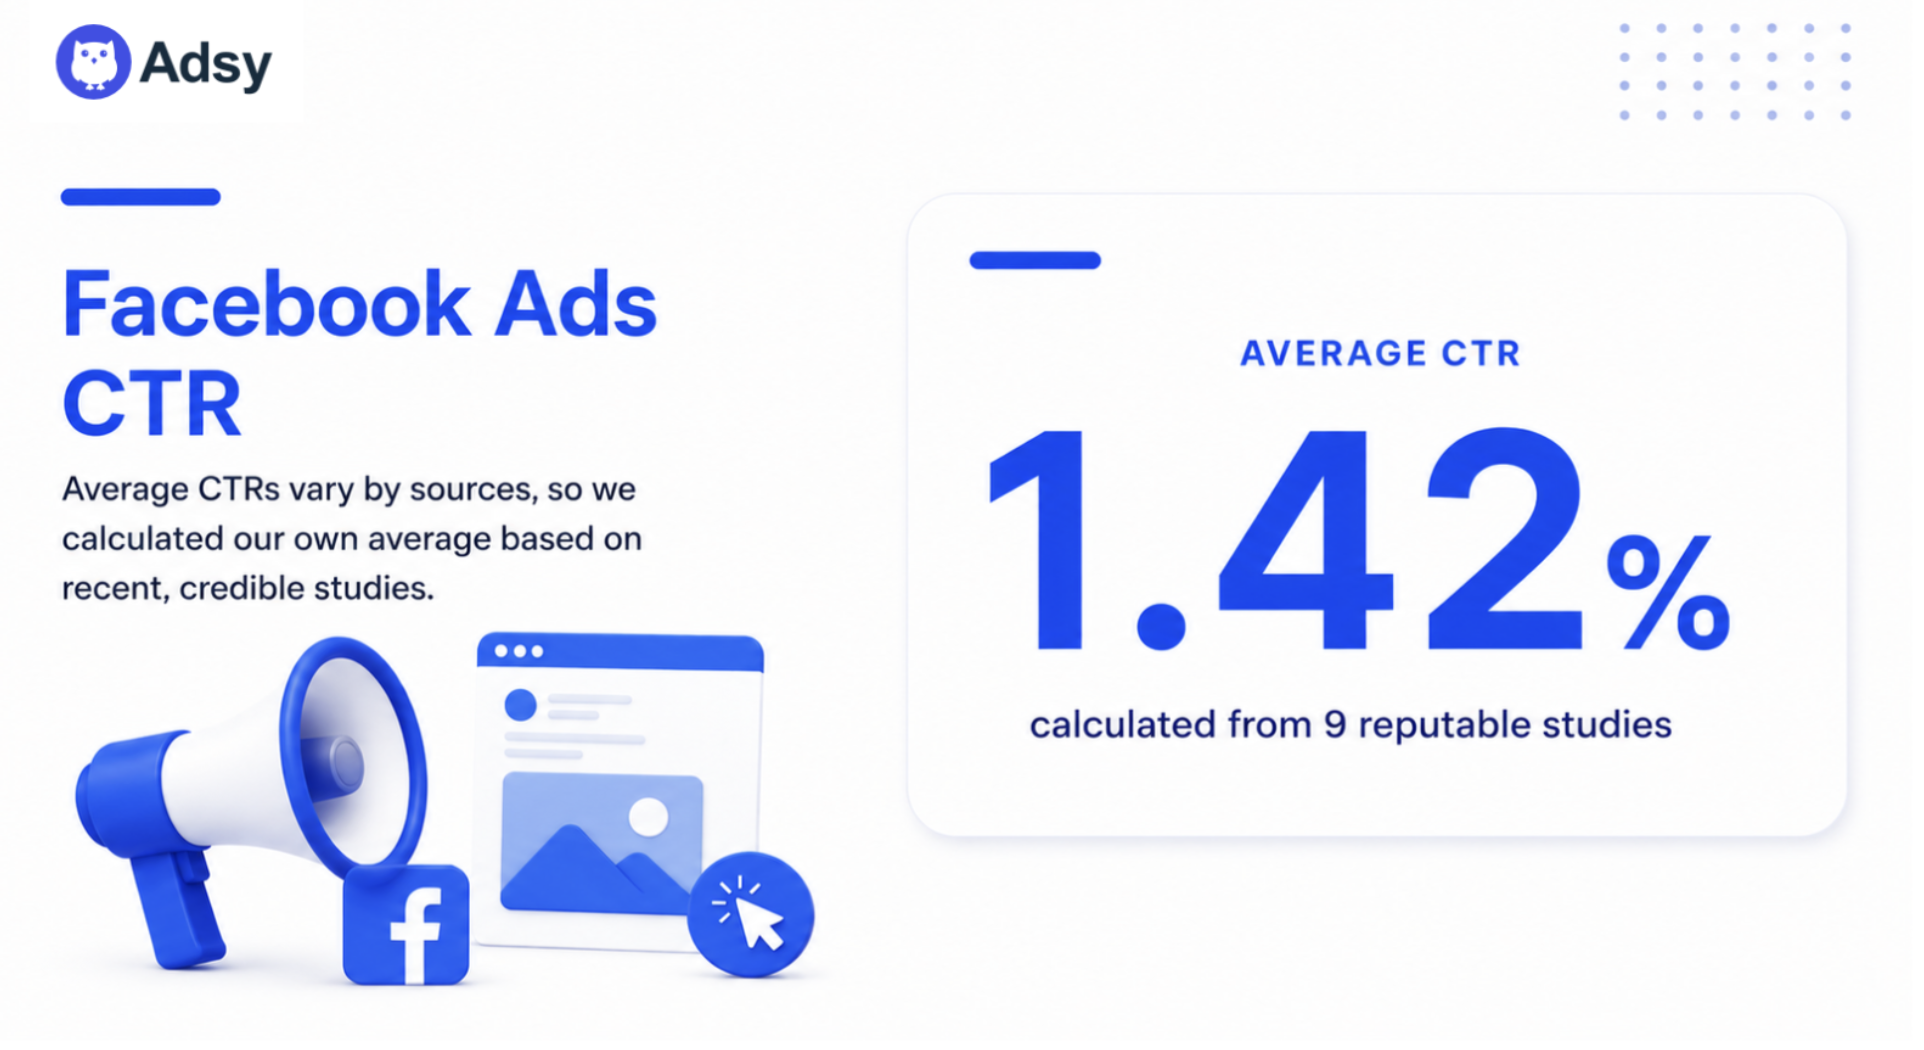
Below is a list of studies we used to calculate the average:
- 1.49% SearchLab (updated March 17, 2026)
- 1.49% Conversion Studio (updated June 28, 2026)
- 0.89% AdLibrary (February 24, 2026)
- 2.19% Triple Whale 2025 (updated April 7, 2026)
- 1.11% Social Status (updated February 11, 2025)
- 0.90% WordStream (June 30, 2025)
- 0.90% Focus Digital 2025 (updated January 2, 2026)
- 1.90% Databox (updated 2025)
- 1.87% AgencyAnalytics (January 9, 2025)
LinkedIn Ads
Average CTR for LinkedIn Ads: 0.51 %
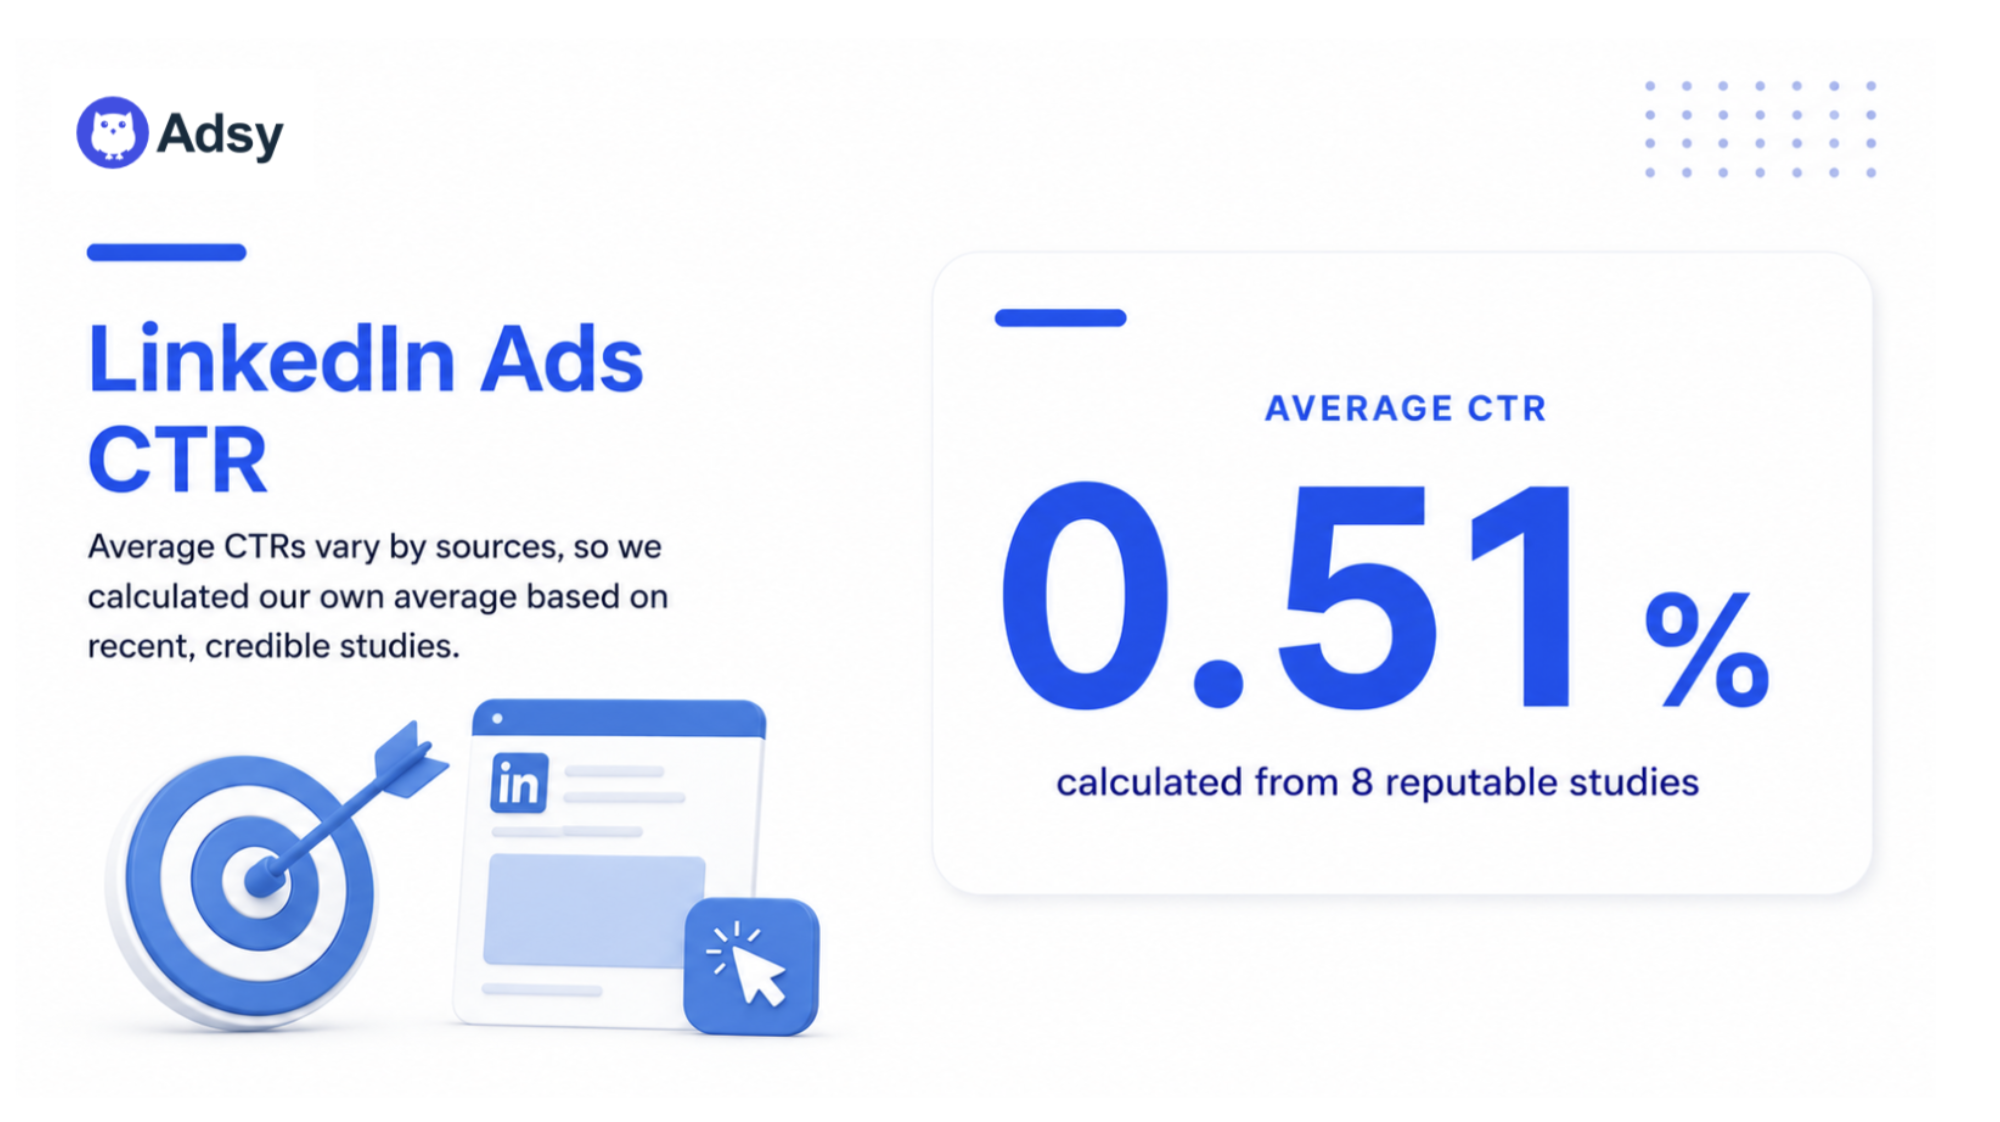
These are the CTR benchmark studies we used to calculate the average:
- 0.55% The B2B House (updated January 28, 2026)
- 0.44% AJ Wilcox (July 18, 2022)
- 0.55% FactorsAI (June 28, 2026)
- 0.55% ZenABM (February 16, 2026)
- 0.39% Meet Lea (Updated on May 17, 2026)
- 0.55% Percuity AI (Updated February 27, 2026)
- 0.55% MetadataONE (Updated April 8, 2026)
- 0.52% Focus Digital 2025 (updated January 2, 2026)
TikTok Ads
Average CTR for TikTok Ads: 0.96 %
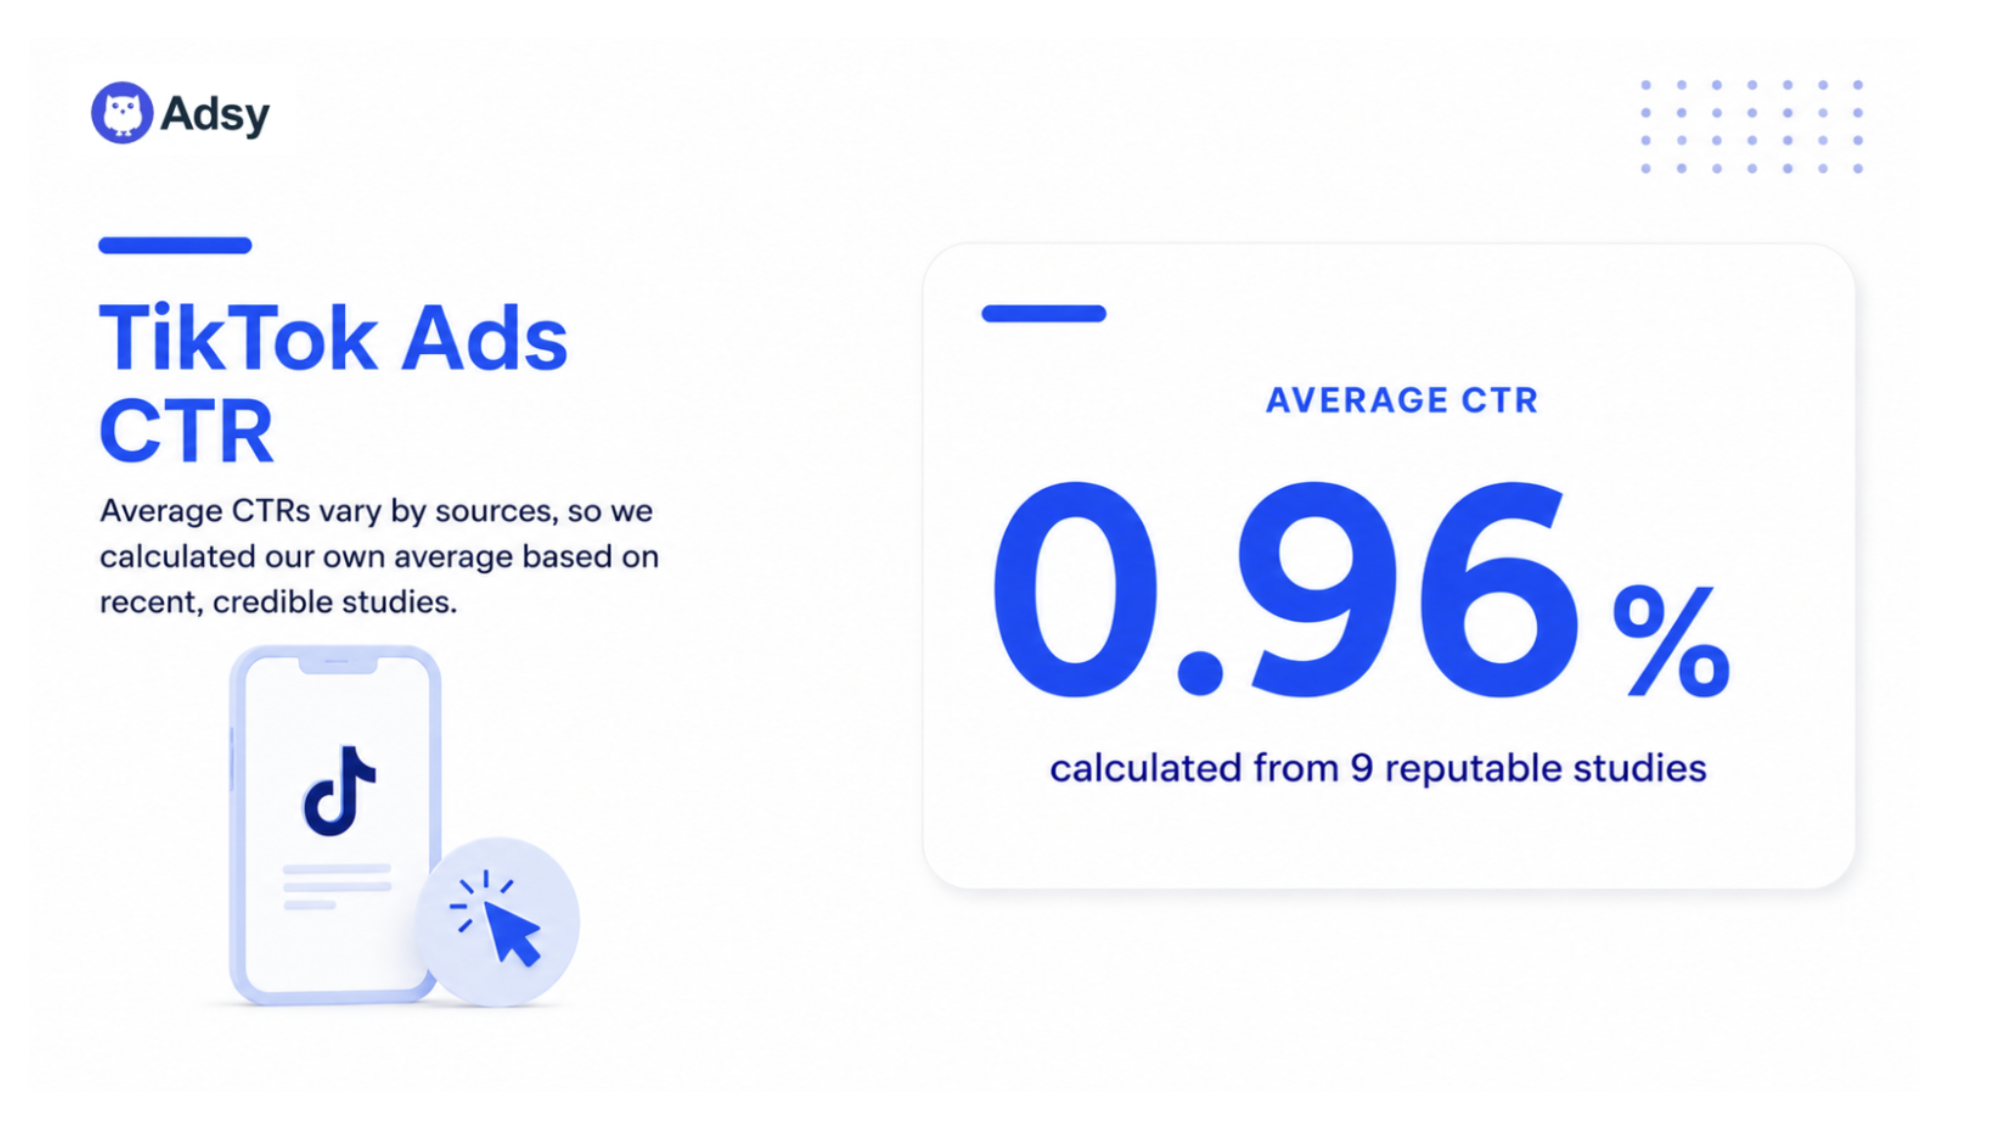
These are the studies we used to calculate the average CTR benchmark :
- 1.77% Triple Whale 2025 (updated March 24, 2026)
- 0.95% MHI Growth Engine (updated February 17, 2026)
- 0.84% Enrichlabs 2024 (updated January 9, 2025)
- 0.73% Strike Digital (updated November 21, 2024)
- 0.84% WebFX (published October 27, 2025)
- 0.61% Lebesgue (updated March 1, 2026)
- 0.84% North American Media Experts (updated January 6, 2026)
- 1% CapCut (updated June 16, 2025)
- 1.05% KoroAI (updated April 2, 2026)
Organic search CTR benchmarks by position
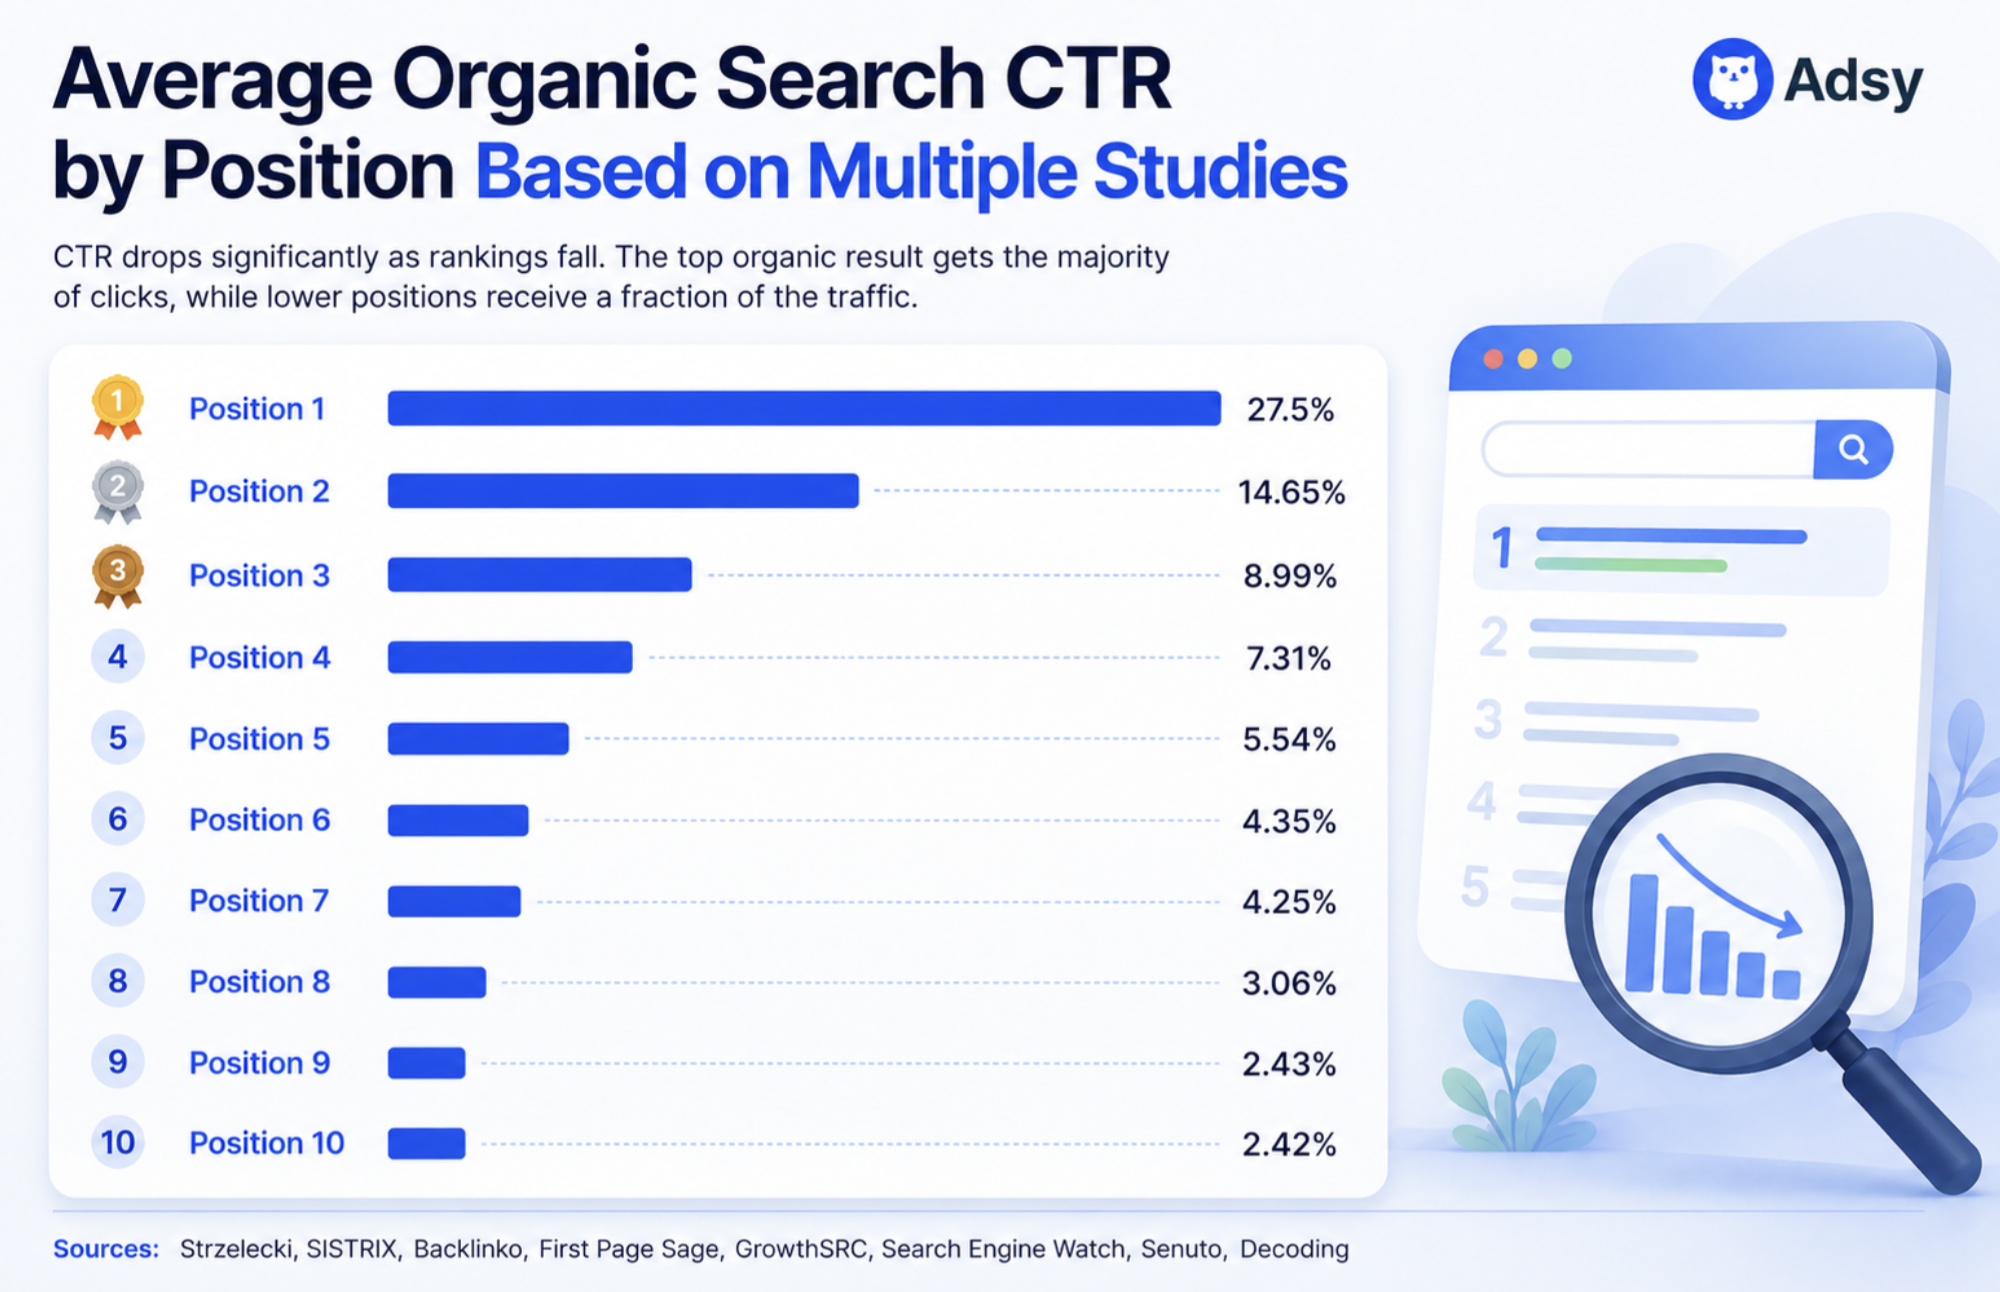
Here are the average organic search CTRs by position:
- Position 1 – 27.5%;
- Position 2 – 14.65%;
- Position 3 – 8.99%;
- Position 4 – 7.31%;
- Position 5 – 5.54%;
- Position 6 – 4.35%;
- Position 7 – 4.25%;
- Position 8 – 3.06%;
- Position 9 – 2.43%;
- Position 10 – 2.42%.
It’s pretty difficult to calculate a single average CTR for organic search that we can truly rely on.
As you can see, organic search CTR depends heavily on your rankings in Google search results.
That’s why we didn't calculate one overall average.
Instead, we collected data from 9 studies for each position and then averaged the results. This gives you a more realistic picture of what to expect at each position, without exaggerating the numbers.
But these days, there's one thing that’s actively changing this pattern significantly across all positions. It’s AI Overviews.
How AI Overviews impact organic CTR
Even ranking first no longer automatically means you'll get the click. Many users can now find the information they need directly in an AI-generated answer.
Here is how it really impacts the search:
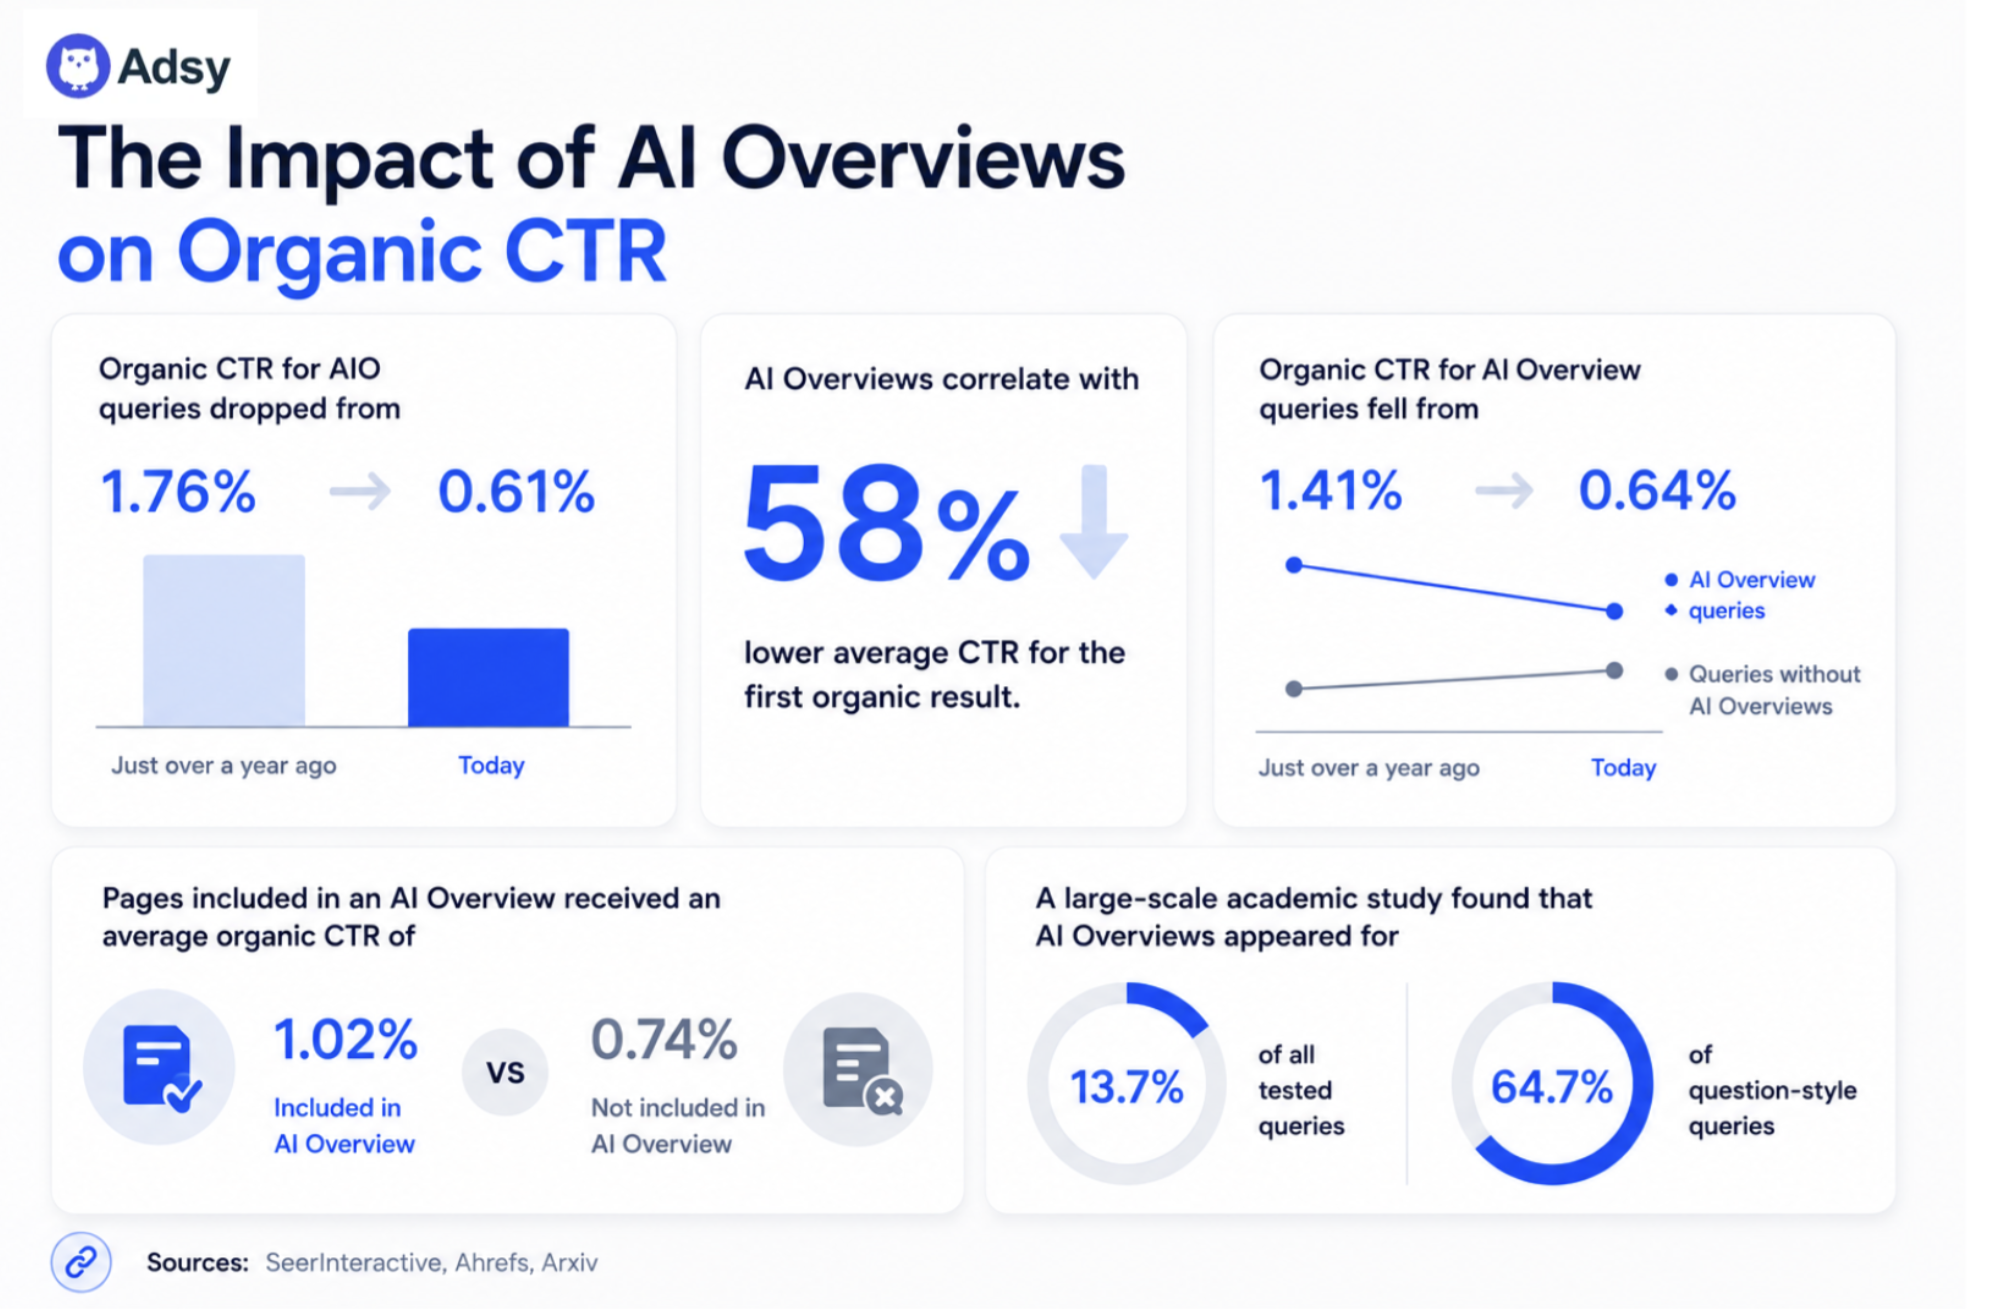
- Organic CTR for AIO queries dropped from 1.76% to 0.61% in just over a year.
- AI Overviews correlate with a 58% lower average CTR for the first organic result.
- Organic CTR for AI Overview queries fell from 1.41% to 0.64% year over year. While queries without AI Overviews saw CTR improve over the same period.
- Pages included in an AI Overview received an average organic CTR of 1.02%, compared with 0.74% for pages not cited in the overview.
- A large-scale academic study found that AI Overviews appeared for 13.7% of all tested queries, but for 64.7% of question-style queries.
Basically, if someone can get the answer they need without leaving Google, they often will.
This “zero-click” reality is hitting informational and “how-to” searches especially hard.
So, if you rely on organic traffic, start thinking about this:
- Try to get your content featured in AI Overviews.
- Focus more on queries where people still click because the AI answer isn’t enough.
Now that we've covered organic search, let's move on to Google Search Ads.
What does a good CTR depend on?
“Good” CTR tells you that your link or ad is drawing attention and pulling traffic to your site, which is ultimately the goal.
But, as you can already tell, there's no universal number that defines a "good" CTR. What's strong in one channel can be weak in another.
Still, average CTR benchmark for each channel can give you a starting point for understanding what a “good CTR” is for a specific channel. Which also can help you with your own analysis.
So what actually moves your CTR up or down?
Let’s take a look at some of the most important factors:
1. Industry
All industries have their own average CTR for each platform.
And that’s okay.
Different products and services have different processes of decision-making. For example:
- Finance and insurance tend to have lower CTR in paid search. Simply because the decisions are more complex. Almost nobody clicks on a life insurance ad the way they click on a pair of sneakers.
- E-commerce and retail often have stronger CTRs. The intent here is more immediate, and decisions are not that complex.
That's why knowing your industry baseline is important. Don't chase numbers that don't apply to your space.
2. Targeting the right audience
The more relevant your audience is, the more likely they are to click. Use the data you have to reach people based on:
- Their interests
- Behavior
- Demographics
- Location
You will be left with fewer people once you narrow down. But it's usually much more effective to reach a smaller but highly relevant audience than dozens of random users who will never click.
3. Ad budget
Budget can play a big role in CTR. A limited budget can push your ads lower on the page or limit how often they show up.
Fewer impressions lead to fewer clicks.
And not because your ad is bad. Just because not enough people see it.
At the same time, more budget doesn't automatically mean better CTR. A large spend pointed at the wrong audience or wrong keywords is still money going nowhere.
So, think of budget as a visibility lever, not a CTR lever. More visibility to the right people tends to lead to more clicks.
4. Copy and headlines
These are two major elements:
- Your headline is the first thing people notice. If it doesn't catch their attention or clearly explain what you're offering, they'll simply scroll past it.
- Then comes your copy. It should tell users why your page is worth clicking on and what they'll get from it.
The best practice here is being relevant.
Use language your audience understands and highlight the main benefit. Think carefully about what your audience is actually searching for.
If your headline and copy align with user intent, there are greater chances of getting a higher CTR.
5. Visuals (where applicable)
Сlear visuals tend to encourage more clicks.
A bad image can easily push your audience away before they even read your copy. So, it's worth paying attention to a few basics:
- Make your ad mobile-friendly.
- Make sure your images are of high quality.
- Use vibrant colors.
Bottom line
As you can see, there isn't one average CTR that applies to every marketing channel. It all depends on where you're advertising, your industry, your audience, and many other factors.
That's why it's always better to compare your results with benchmarks for the specific channel you use.
One more thing worth remembering: CTR is just one metric.
A high CTR doesn't automatically mean your campaign is successful. If lots of people click but don't convert, there is something wrong with your campaign.
That's why it's important to look at CTR alongside other metrics. That can be conversion rate, bounce rate, cost per acquisition, etc. Together, they give you a much clearer picture of how your marketing is actually performing.
FAQ
What is CTR?
CTR (click-through rate) measures the percentage of people who click on a link, ad, email, search result, etc., after seeing it.
It is one of the most common metrics used to evaluate how effectively content attracts clicks.
What is a good CTR?
There isn't a single CTR that is considered good for every situation.
What's considered a strong CTR depends on where you're advertising and who you're trying to reach.
A good way to judge your performance is to compare it with average CTR benchmarks for your channel.
How do you calculate click-through rate?
The formula is pretty simple. Just divide the number of clicks by the number of impressions and multiply the result by 100 to get a final result.
CTR = (Clicks ÷ Impressions) × 100
Why is my CTR low?
There are many reasons why your CTR is low and not increasing.
Here are some factors that can be a reason:
- Targeting the wrong audience
- Using broad keywords
- Weak headlines and ad copy
- Poor or generic creatives
- Low search rankings
- High competition in your industry
- Limited visibility
- Device differences (mobile vs desktop)
- Seasonality or timing of your campaigns
In most cases, CTR issues are not caused by a single factor.
So, It's better to analyze all these variables to identify where improvements are needed.
How can I improve my click-through rate?
To improve your CTR, you need to make sure that your ad or content matches the user’s search intent.
Take these strategies into consideration:
- Matching user intent with keywords and messaging
- Writing clearer, more compelling headlines that highlight value
- Using a strong CTA
- Testing variations of headlines, email subject lines, etc., through A/B testing
- Improving targeting to focus on more relevant audiences
- Enhancing visuals and creatives
It’s also important to keep your ad and landing page consistent. If users click expecting one thing and see something different, they will leave quickly.
How often should I monitor CTR?
CTR should be monitored regularly. But how often mostly depends on the channel.
- For paid ads, it is often checked weekly or even daily. This helps quickly spot issues and improve weak ads.
- For SEO, monthly tracking is usually enough. Organic results change more slowly.
Regular tracking helps you see real trends. It also helps you understand what is causing changes in CTR.
All trademarks, logos, images, and materials are the property of their respective rights holders.
They are used solely for informational, analytical, and review purposes in accordance with applicable copyright law.




 Sign Up
 Sign Up