
A Complete Guide to Market Sizing: Definitions, Types, and Examples

You’ve definitely heard people say:
“There’s a huge market for this.”
And then someone would always ask:
“How big exactly?”
That’s the moment you realize that “huge” is unclear. It’s simply vague. So, it’s definitely not the best way to define your sector. What’s the best thing to do, then?
Do proper market sizing.
This is how you go:
- From “people will definitely want this”
- To “there are around 600,000 potential customers who spend roughly $200 a year on similar products, which puts the total market at $120 million.”
You might also want to call it a difference between a nice idea and a solid business plan.
But how exactly do you do market sizing? What types of it are there? Let's explore these and many other vital questions in this guide.
What is market sizing?
Market sizing is your attempt to measure demand before making a business decision. It is often used to decide whether a particular industry is promising enough.
There are different ways to calculate it:
- Some start from broad industry data and narrow down.
- Others begin from the ground up (from actual customer numbers or sales) and build up to a total estimate.
And yet, the method matters less than the logic behind it. What you’re really trying to understand is the opportunity and the share you could reasonably win.
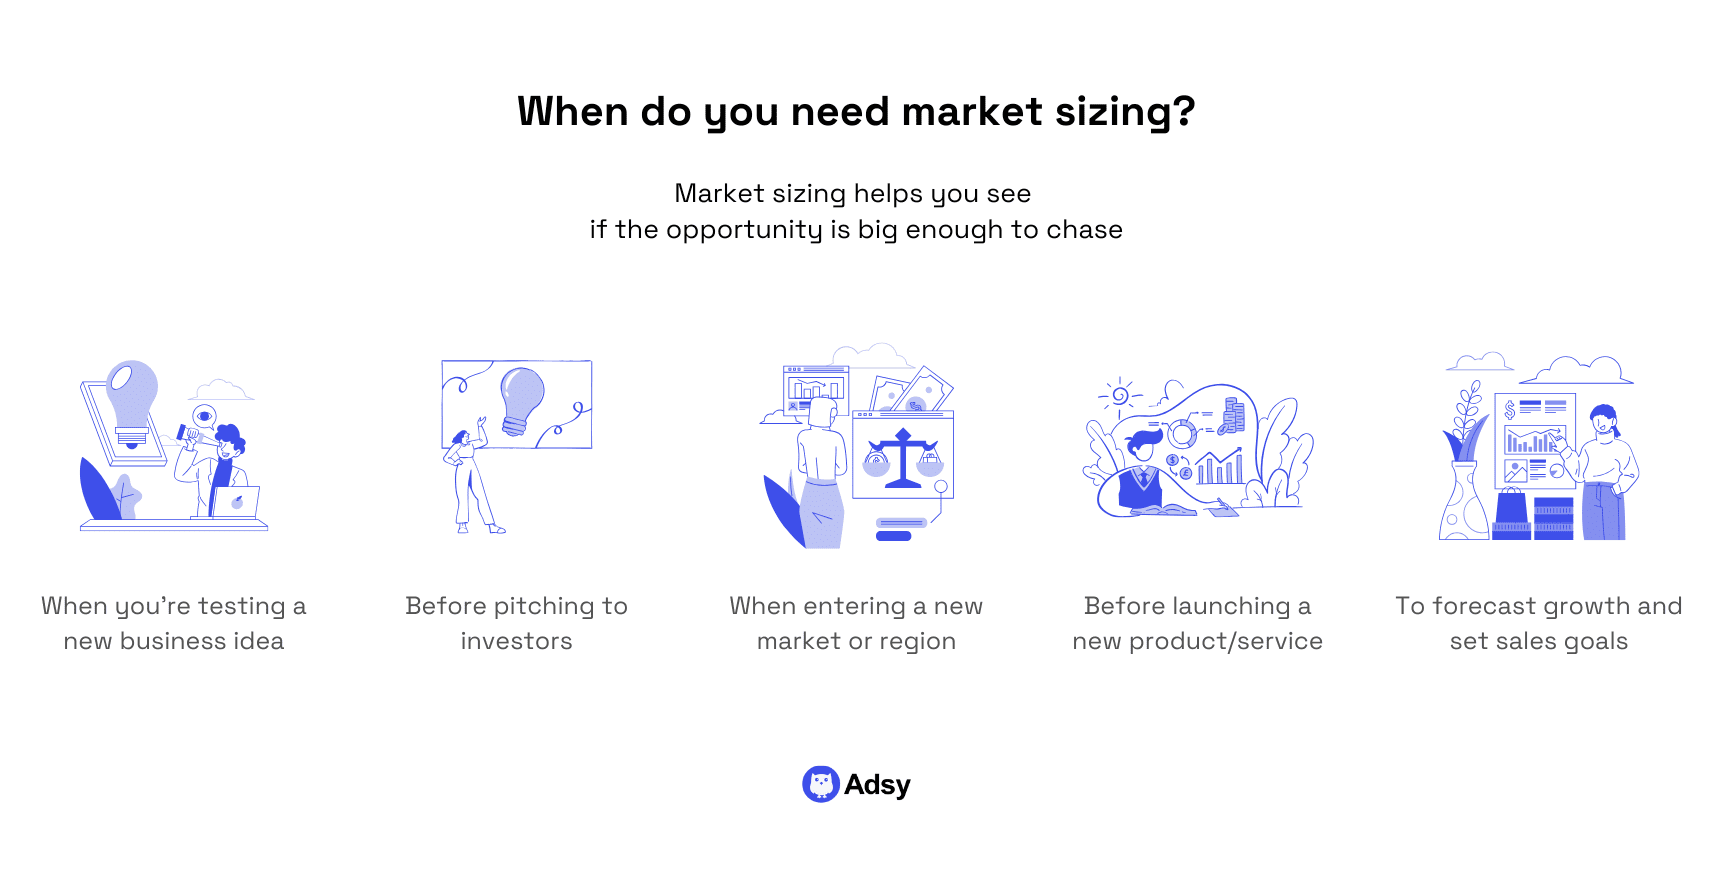
Do you need it and when?
To put it briefly, you need market sizing every time you're about to bet time, capital, or reputation on a business move.
But you have to understand that it is not a checklist item. It’s something you come back to every time your business model shifts, your target audience changes, or your industry conditions evolve.
For example, startups go through this cycle constantly:
- You launch thinking you're building a tool for freelancers, and suddenly, mid-sized agencies start showing up.
- Or the opposite: you thought you’d win enterprise, but SMBs find you first.
Business reality humbles and redirects everyone. That’s why successful founders treat market sizing as a living model.
Typically, your market research updates as:
- Fresh secondary statistics become available.
- New historical data flows in.
- Customer surveys reveal real purchase frequency.
- Your assumptions meet reality, and reality wins.
And investors really care about this one. Not because they expect you to predict the future. It is because market sizing shows you understand the terrain.
A founder who knows the landscape makes more informed decisions. And that’s something every investor appreciates.
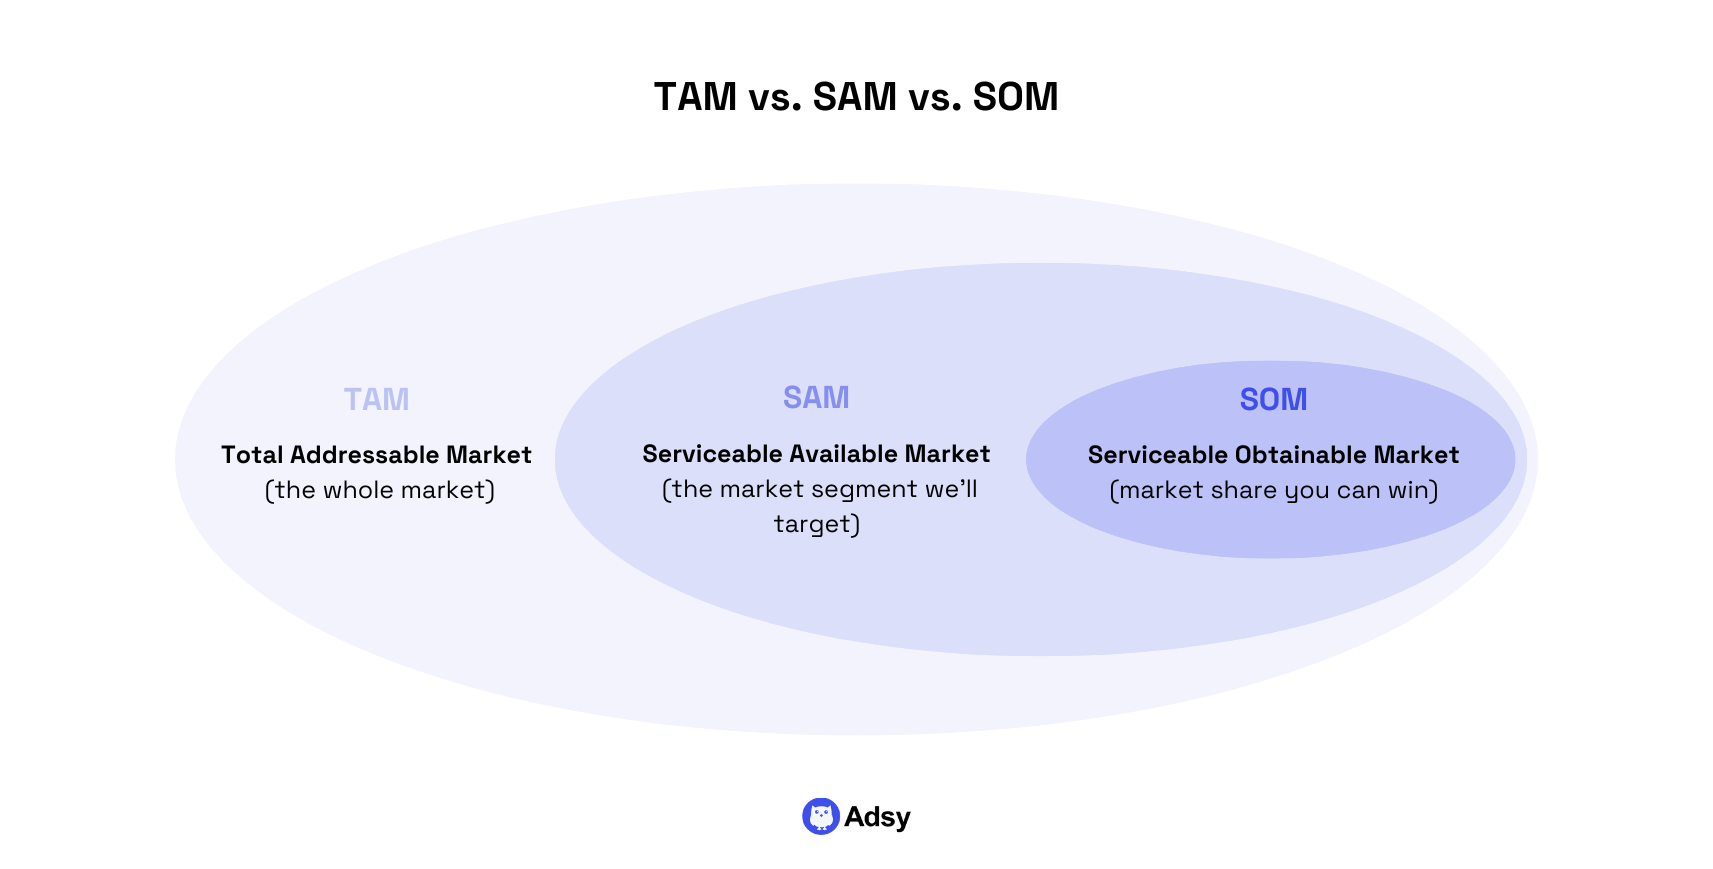
TAM vs. SAM vs. SOM: What’s the difference?
When doing all the calculations, you’ll definitely face the three layers of sizing: TAM, SAM, and SOM.
They sound like jargon, right? However, they are simply a way to break a “big unknown” into smaller pieces and make it understandable.
You might be surprised to hear this, but TAM, SAM, and SOM form a funnel. Not in a marketing sense, though, but in logic.
It is easy to define them:
- TAM shows the total size of the revenue opportunity.
- SAM defines the relevant part for your product.
- SOM describes the attainable part you can reasonably serve.
Each level removes assumptions and adds more reality to your vision.
That’s why it provides valuable insights. TAM is possibility, SAM is focus, and SOM is reach. But let's take a closer look at each one.
TAM (Total Addressable Market)
Let’s put it this way: TAM is the broadest view of your potential. It represents the total demand for a product or service.
In other words, it’s every potential customer, across every geography, under the assumption that you could somehow reach all of them. In practice, as you understand, it’s rarely achievable.
No company captures its entire TAM. But it’s useful because it gives you a sense of the overall industry value.
It is sort of like the total pie before you start cutting it into portions that are actually digestible:)
For example:
Say you build accounting software. The TAM would be the total global spending on accounting tools. It doesn't matter if it is sold by you, QuickBooks, or anyone else.
You look at this number not because you think you’ll own it, but to understand the ceiling.
SAM (Serviceable Available Market)
Now, this is where the picture gets more relevant. SAM is the portion of the total market that your product or service can actually serve.
Of course, it is not based on a random assumption. The foundations are your:
- Specific features,
- Pricing,
- Distribution model, etc.
To put it a bit differently, SAM answers the question, “What part of the total market makes sense for us?” It filters out all the “noise” and helps you focus on where your product/service actually fits.
For example:
- If your accounting tool is built for small businesses, it’s logical to exclude large enterprises and individuals.
- If you operate only in the EU, you would exclude all the other regions. Makes sense, right
If this were a real case, you’d target “small businesses in the EU that need accounting tools”. This is your true SAM, not “everyone who needs accounting software”.
But why does this step matter at all?
Well, because it’s easy to overestimate your reach. For instance, many startups confuse TAM with SAM. They think, “If the global market is $50 billion, and we just get 1% of it, that’s half a billion.”
But that's... completely crazy. That 1% assumes you can:
- Sell to customers you’ll never meet,
- In regions you’ll never enter,
- Under conditions you can’t control.
And this makes no sense. So, SAM “forces” you to narrow down to the segment you can really address. And that would be the opportunity available to your model.
SOM (Serviceable Obtainable Market)
Finally, SOM is the part of the revenue potential you can realistically win.
It’s the intersection of what’s available to you (your SAM) and what you can capture. Calculations here should be done given your:
- Competition,
- Pricing,
- Distribution,
- Current capacity, etc.
Essentially, SOM is your working target. It’s the value pool you expect to reach in the near term, most likely in three to five years.
For example:
If your SAM is small businesses in Europe, your SOM might be small businesses in Germany, where your team already operates and has traction.
Unlike TAM and SAM, which rely on industry data, SOM comes from your own experience. That includes:
- Conversion rates,
- Marketing budgets,
- Customer feedback,
- Growth patterns, etc.
4 types of market sizing
First of all, let’s make it clear: there’s no single right way to calculate market size. The method depends on what data you have and how close you are to the sector itself.
Whatever route you take, the goal is the same. You have to discover:
- An accurate picture of your target space,
- Your potential customers,
- How much potential revenue is really on the table.
Now, let’s walk through the four main ways to do it.

Bottom-up market sizing
Bottom-up market sizing is what you might call the most grounded approach. You start with the data you already have or can observe and build your way up to the full picture.
The data you take into account will vary depending on your business model. But essentially, you look at:
- The number of target customers you could realistically sell to,
- And what each is worth to you.
Multiply those, and you get an estimate of your potential opportunity.
For example:
If you’re running a SaaS company, you’d start with how many businesses fit your target audience.
Maybe there are 20,000 small businesses in your region that match your customer profile. If your annual contract value is $2,000, that’s a SAM of $40 million.
The strength of the bottom-up approach is precision.
What's its weakness then?
It can underestimate the true potential if you don’t yet have full visibility of your entire sector.
That’s why it’s often combined with another method. It could be top-down or triangulation to check if the numbers make sense.
Top-down market sizing
Top-down market sizing is exactly the opposite of the bottom-up tactic. Basically, you take the whole revenue opportunity (TAM) and try to estimate how much of that you could win (SOM).
For example:
Say a report shows your industry’s TAM is worth $10 billion.
You might then apply “filters”:
- Maybe only 10% of that TAM is located in your region,
- And within that, 5% fits your SOM.
- That leaves you with $50 million of revenue potential.
As you understand, here, everything starts with the big picture.
With the top-down approach, you use industry-wide data and then narrow it to your target market using assumptions and filters.
Value-theory approach
Sometimes, the value pool is not at all about how many people could buy your product. It is about how much value you actually create.
The value-theory approach, as you may have guessed, has this idea at the core.
You don't count customers or guess revenue. You start with one question: “How much value does my product/service bring to the customer?”
Then, you estimate how much of that value you can reasonably charge for. The idea is to understand how much value your product/service actually generates.
If your business cuts costs for other companies, calculate how much they save and multiply it by the number of firms that are likely to use your solution.
For example:
Suppose you save companies $10K/month. And there are 50K businesses who might use your product/service, then your total value created could potentially be $6B per year. This represents your TAM. The SAM would then be around $1.2B (if we assume it’s 20% of the market).
This approach is especially useful when your product/service is:
- New and innovative (something there is no research and data for),
- Doesn’t fit into any existing category.
The value theory is the best choice when there is no industry report or sector benchmark for what you do. You basically just build the logic yourself.
Triangulation
Have you ever compared your own estimate with someone else’s and split the difference? Well, if your answer is yes, congratulations.
You’ve done triangulation (the rhyme wasn't intentional:)).
In market sizing, triangulation means using multiple methods. That would be top-down, bottom-up, and sometimes, value theory. Why? Essentially, to cross-check your results.
Here, you care less about finding the “perfect” number and more about seeing whether your assumptions make sense.
For example:
Say your top-down approach gives you a $1 billion opportunity, but your bottom-up model suggests $300 million. That’s a big gap.
And that's a good reason to dig deeper. Maybe your TAM was too broad, or maybe your SOM is smaller than you thought.
How to do market sizing in 8 steps
Now you know the methods of market sizing, but before you can apply them, there are some things you should do.
Here are eight easy steps that will help you understand your industry and potential.

1. Define your target audience clearly
Of course, everything starts here.
You can’t measure an opportunity you can’t describe.
A market is not “people who might want what you sell.” It’s a specific group of potential customers with a shared problem, a shared willingness to pay, and similar behavior patterns.
That means your job is to define not just who they are, but how they buy.
If your product is a CRM for small businesses, “all SMEs” can't be your target audience. You need to break that down by:
- Geography,
- Company size,
- Industry,
- Buying process, etc.
The difference between targeting “all SMEs in the U.S.” and “e-commerce SMEs with under $10M in annual revenue” could shrink your TAM by 80%. But make your SOM ten times more realistic.
One more thing many businesses miss: defining your audience also tells you which data sources you can trust:
- Government census data works for demographic-driven products.
- LinkedIn Sales Navigator or Crunchbase is better for B2B.
- Consumer apps? You’ll probably rely on app store analytics and purchase frequency surveys.
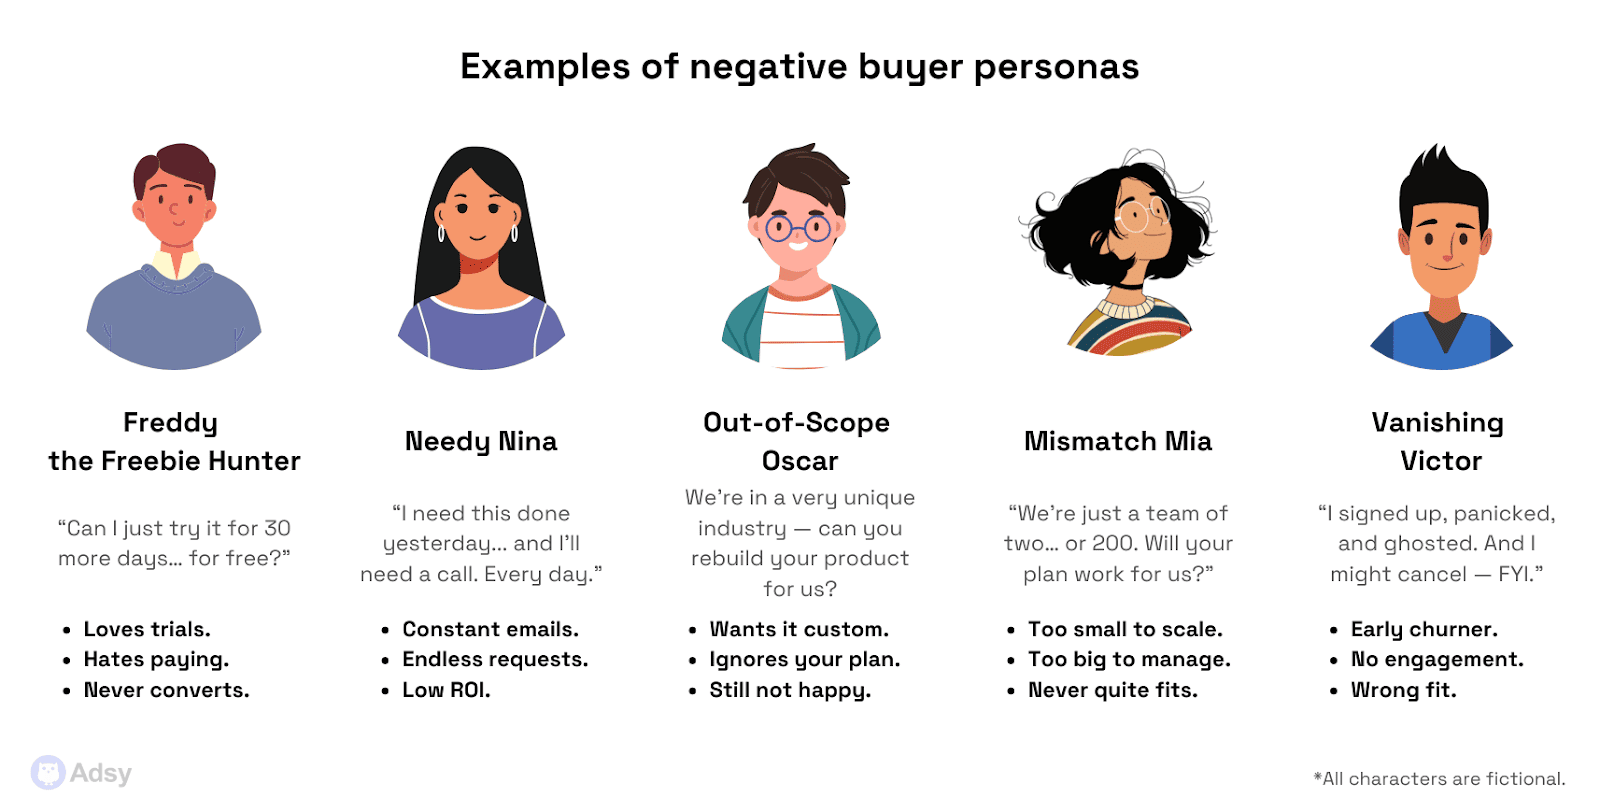
At this stage, it might also be helpful to establish a negative buyer persona. This will guide you away from audience segments that make no sense for your business.
2. Understand the depth of the problem you’re solving
Before you even start conducting market research, pause and dig into the actual problem space.
Many businesses jump into the “people who will buy this.” But accurate opportunity estimation begins with understanding why anyone buys in the first place.
Here, you're mapping how painful the problem is, who feels it the most, and how urgently they want it solved.
So, start by asking:
- What is the customer trying to get done?
- What triggers the need?
- How are prospective clients solving it today?
- How much energy, time, or money do they currently spend to solve it?
By having an understanding of the pain points and context, you’ll shape better marketing strategies.
This is how you get stronger product positioning and more effective marketing and sales efforts. Most importantly, you’ll size the sector you're actually entering.
Once you know who’s willing to pay, you can estimate:
- What percentage of the total audience actively buys similar solutions today,
- How often they buy them,
- What they currently spend (your average value),
- What channels realistically reach them (marketing and sales efforts).
3. Clarify the use case or market scope
Your product (any product, in fact) lives inside a context of use. That’s why you can’t size “the fitness industry” if what you sell is “a sleep tracking ring.”
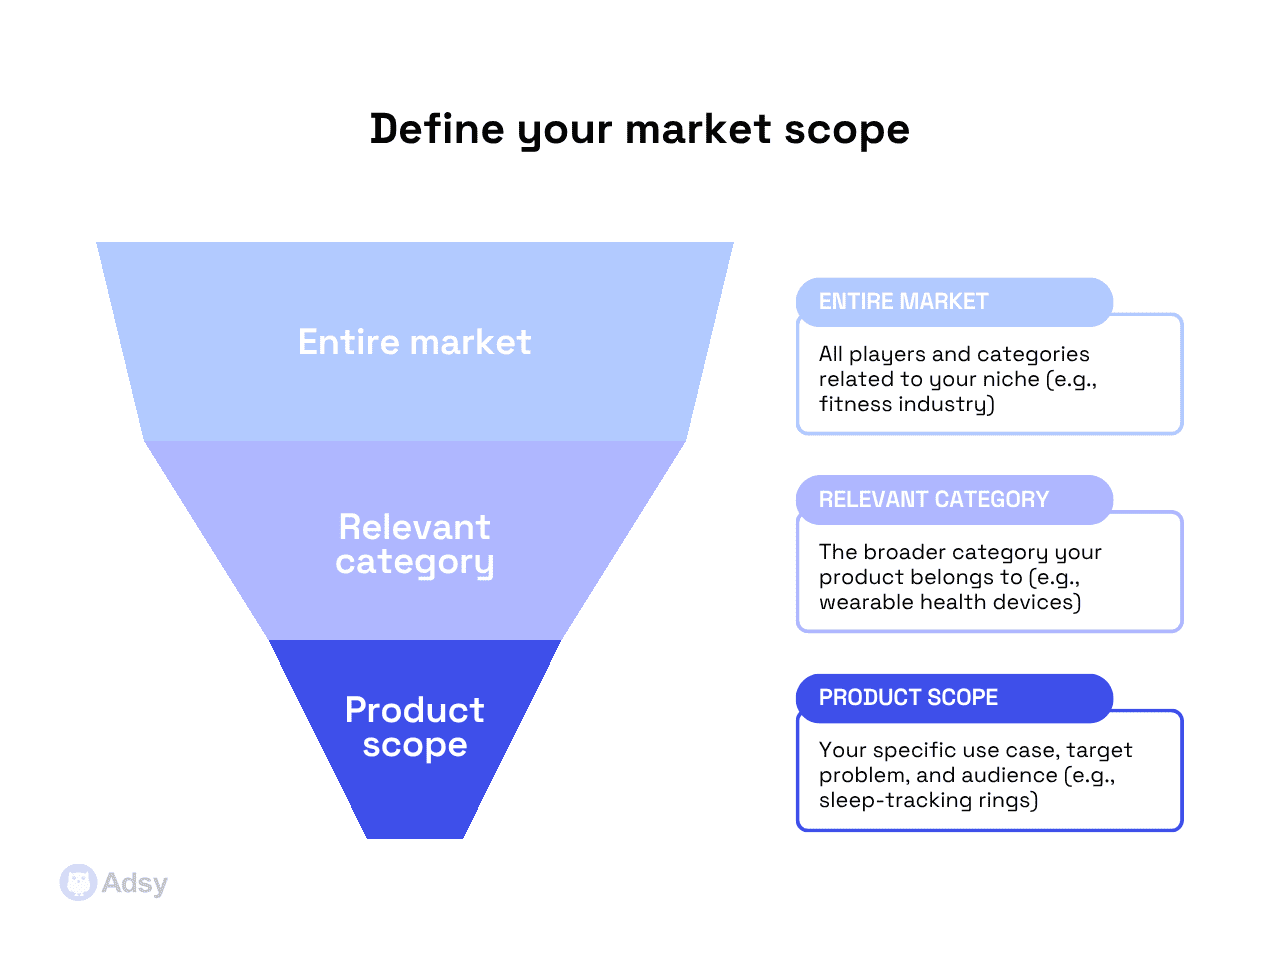
This step forces you to define what part of the buyer segment you actually serve.
Analysts call this “scoping,” and it’s one of the most underestimated steps in industry research.
If you skip it, you end up comparing your product to irrelevant existing offerings. What's more horrible, your market value estimate becomes… pure fantasy.
Slack, for example, wasn’t competing with “the entire communication software industry.” It was competing with “internal team messaging solutions,” and that was just a little slice of that world. Fast, internal communication defined its early SAM.
So, make sure you clarify:
- What problem are you solving?
- What existing products or solutions does your audience already use?
- What part of that entire sector are you replacing, improving, or redefining?
Your market size data is only as accurate as your scope. And your potential revenue is only as credible as your scope’s realism.
4. Choose an approach: top-down, bottom-up, value-theory, or hybrid
We’ve already talked about these approaches, so let's just briefly summarize them.
Essentially, each approach tells a different story:
- The bottom-up approach starts with something tangible you have. Your average sale value, purchase frequency, the number of potential customers you can actually reach, etc. Then, it scales up.
- The top-down method starts with macro data. So, you'll consider industry reports, government statistics, or industry value figures. Then, it narrows down to your target domain. For example, geography or customer type.
- The value-theory tactic looks into the value your product provides and how much users are willing to pay for that value.
- The hybrid (or triangulated) model uses several approaches. It checks your TAM/SAM/SOM logic from multiple angles, which is often the most credible route for potential investors.
Pick your method based on what data you trust or need to prioritize at any given moment.
5. Collect relevant data
Data either makes or destroys your model.
You have a target market in mind, and you've scoped the use case. Right? Well, now you have to prove that your sector and user segment actually exist, and in the size you think they do.
That's something to work on.
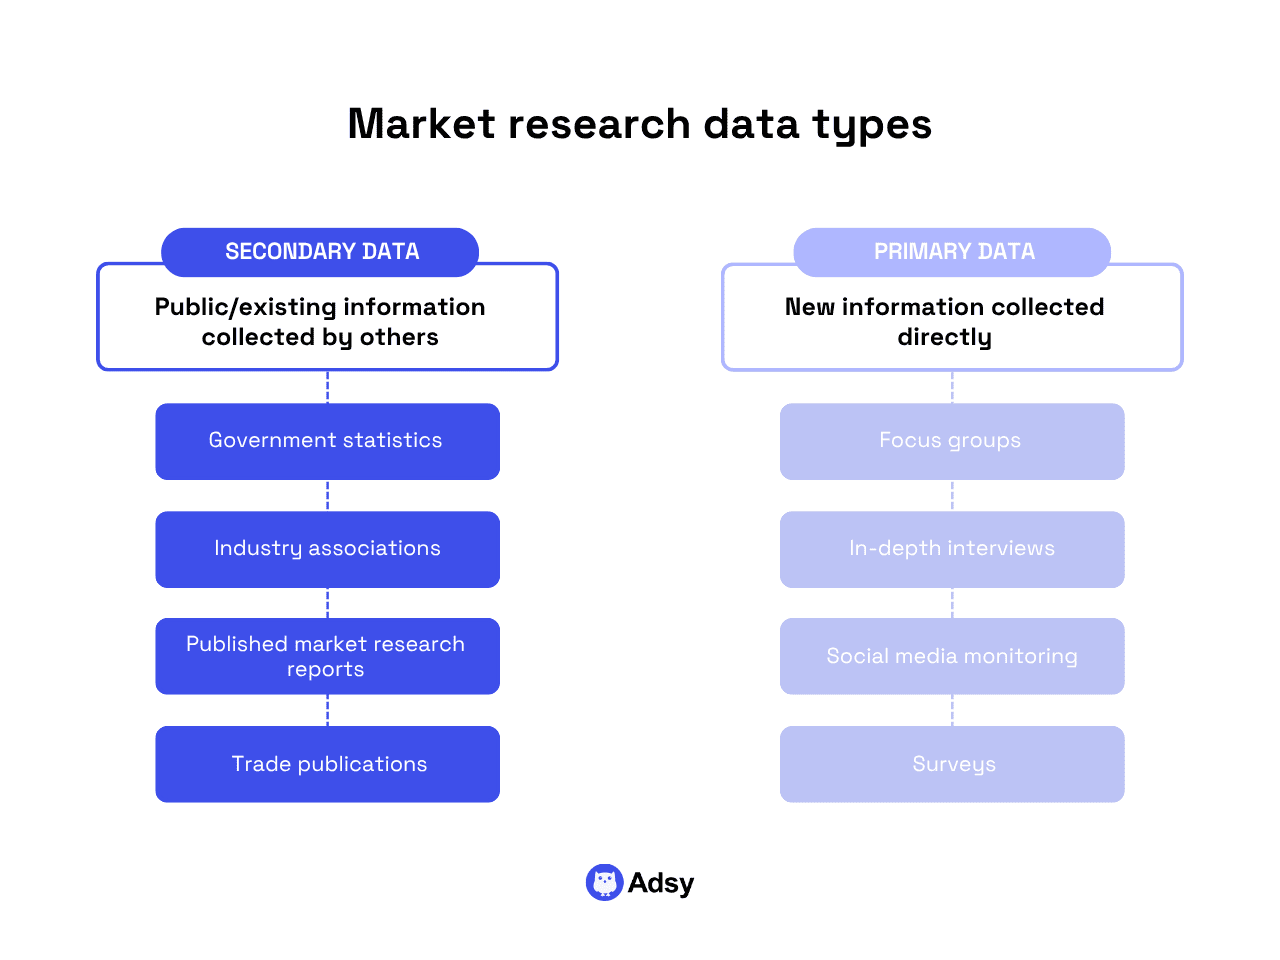
Real market sizing pulls from multiple data layers because no single source tells the full story. You need breadth and depth, as they say.
In most cases, you’ll stitch together lots of secondary research (reports, databases, analyst papers) and some of your primary research (surveys, interviews, and real usage data).
But what do they give you in essence?
- Primary research is where you learn uncomfortable truths. Your assumed average revenue per customer might be too high. And your potential demand might be more niche than you hoped.
- Secondary data gives you structure. The historical growth rates, geographic splits, spending patterns, etc. It tells you what the industry has been like.
If you’re entering a new sector, rely on industry benchmarks and historical sales data. If you have passed the customer acquisition phase, use customer surveys to estimate purchase frequency. You can also calculate average revenue and potential expansion.
Good market sizing analysis often feels a bit messy.
But that’s absolutely okay. Precision comes with each iteration, so you don't have to expect some ideal dataset from the start.
6. Build your model
Now, it’s time to take all the information you have and build your own market sizing model. At a minimum, it should include:
- The number of potential customers in your target segment,
- Average revenue per user or average sale value,
- Purchase frequency or renewal cycle (and what influences consumer purchase decisions),
- Market penetration assumptions (i.e., what % you can realistically capture).
For example, say your startup sells workflow software to design studios. You find 25,000 relevant studios globally. The average annual contract value is $2,500. If you assume you can reach 10% of them within five years, your SOM is $6.25M annually.
You can then layer in:
- Growth rates,
- Market entry scenarios,
- Pricing sensitivity to model how your industry value evolves, etc.
Analysts use Monte Carlo simulations or scenario modeling to stress-test this. But even simple spreadsheets, built with disciplined assumptions, go a long way.

Source: Investopedia
7. Validate your assumptions
Once your model’s built, go back and break it. That’s sort of a fun part:)
Ask as many questions as you can:
- What if my customer demand is 30% lower?
- What if the average sale price drops by 15%?
- What if marketing efforts take longer to scale?
That's a lot of ifs, but you need to know well what you are assuming. So, talk to existing customers, prospective buyers, and even competitors if you can.
Professional analysts often run a benchmarking exercise here. They compare their projections to actual industry data from similar companies or public filings.
If your TAM suggests a $5B opportunity but the top three competitors together make $600M, your calculation might be inflated.
8. Cover stress-test scenarios (best case, base case, worst case)
Look, even the cleanest model tends to break in reality.
That’s why good sizing always includes sensitivity analysis. It is just common sense to explore how fragile your assumptions are.
So, build best-case, base-case, and worst-case projections. And then, ask:
- What if the industry growth rate slows down?
- What if customer acquisition costs rise?
- What if market entry barriers increase due to regulation?
Stress-testing reveals which parts of your business are most exposed to industry shifts, and which are resilient.
For investors, it shows your maturity. For you, it builds a real strategy that won’t crumble after the first real-world challenge.
After all, when you know your weak points, you can build a business plan that adapts to them.
How to calculate market size (with examples)
So now, when we’ve explored how it all looks in theory, let’s take a more practical angle:
- What methods should you use in each particular case?
- Where do you look for the market?
- And how to use formulas for each method depending on the output?
Here you go.
Example 1: SaaS B2B tool (bottom-up method)
Imagine you’re building a workflow tool for architecture studios. For example, something like Notion, but for architects.
This is a textbook bottom-up situation. Why? Because you can easily:
- Identify your target customers,
- Estimate purchase frequency,
- And calculate the average contract value.
You don’t need to guess your sector volume from a random PDF. You can actually count firms.
Let’s build it up from the ground up in real time:
STEP 1:
First, as you know, you need to identify your target audience. Who is that? Professional architecture studios with salaried staff. Not hobbyists, and not students.
How many businesses are we talking about?
According to IBISWorld, there were ~322,000 architectural services businesses as of 2024.
STEP 2:
Next, estimate pricing and average value.
- Say your average annual contract value (ACV) is $4,000.
- Imagine you also did pricing interviews, and most firms said they'd pay $3-6k depending on company size. Great!
So, what is a reasonable penetration?
You can't be delusional here. You’re not becoming the only software architects use. A realistic reachable market in the first 5 years is around 5% of businesses.
STEP 3:
Now, let’s calculate everything. Your summary would be similar to this:
- TAM: $1.29B
- SAM: $515M
- SOM: $25.8M first 5 years
Why does this work?
Because it’s tied to actual customer counts, average sale value, and purchase behavior. This is an accurate approach because it starts from something real and scales up.
|
Layer |
Formula |
Output |
|
TAM |
250,000 firms × $4,000 (ACV) |
$1.29B |
|
SAM |
40% of firms using digital studio tools (reasonable assumption) × ACV |
40% × 322,000 × $4,000 = $515M |
|
SOM |
5% of SAM × $4,000 |
~6,440 firms × $4,000 = $25.8M |
Note: Of course, it’s just an example. Ideally, you should collect more data and make sure that you are as close to reality as possible.
Example 2: Consumer mobile app (top-down and value theory)
Now, imagine you’re launching a mobile app that tracks hydration and sends reminders. Let’s assume you have a free app, in-app purchases, and a premium plan at $4/month.
Here's the thing: consumer markets tend to be messy. You don’t have CRM directories. You have habits, app store behavior, and a potential users scattered worldwide.
This is why we mix top-down data with willingness-to-pay reality (value theory).
STEP 1:
You can start understanding your audience broadly:
- The global wellness app industry (according to Precedence research) is worth ~$11B.
- The habit-tracking app sector is valued at ~$1.7B (according to Straits Research).
- At the same time, according to Business of Apps, ~345M people use fitness apps.
Already far smaller than “billions of smartphone users.”
STEP 2:
Here, you have to figure out who actually cares. So, let’s filter. Imagine you’ve had your own focus groups and run interviews. This primary data showed that:
- Around 20% of fitness app users actively track habit data.
- Water tracking interests around 15% of habit trackers.
- 345M × 20% × 15% ≈ 10.35M realistic prospective customers.
STEP 3:
Now, when you have tangible numbers, it is time to get to revenue logic.
- Say 8% convert to paid (habit apps average 5-12%).
- So, paying users would average at around 828,000.
Average revenue in that case would be: $4 × 12 months = $48/year.
Layer | Calculations | Output |
TAM | 10.35M users × $48 | $496.8M |
SAM | Assume you only launch in the US + Europe initially (50% of users) . So, it's 50% × TAM | ~$248M |
SOM | Capture 2% in 3-4 years | 2% × 5.175M users = 103.5K users × $48 = $5M/year |
Example 3: Marketplace platform (hybrid model)
Let's say you're building a marketplace connecting independent fitness coaches with remote clients across the US.
Hybrid matters here. Why? Because you balance supply-side volume, demand-side willingness to pay, and transaction frequency.
STEP 1:
So, the first step is to find out more information about your customer base:
- There are ~347K registered personal trainers in the US (according to IBISWorld)
- Let’s say you added some surveys. And based on your dataset, you discovered that ~30% operate online/remote or want to. So, it leaves us with ~104K trainers.
STEP 2:
Next, we work toward the demand volume. The number of digital fitness users in the U.S. is ~145M (Statista).
You’d need to conduct additional surveys or find more detailed industry reports to understand what percentage of these users are actually interested in paying for personal coaching. Let’s assume you did it.
And you’ve discovered that it’s 15%. This means ~22M potential paying clients.
STEP 3:
Finally, the opportunity potential would be:
- Average trainer runs ~5-10 remote clients (let’s use 7)
- Average value: $150/month per client
- Marketplace take rate: 15%
Layer | Calculation | Output |
TAM | 22M paying clients × $150 x 12 months | $39.6B total industry value |
SAM | Portion willing to hire independent trainers ~20% | $7.9B serviceable market |
SOM | 1% market share in 5 years | $79M GMV × 15% take rate = $11.85M annual platform revenue |
Why do these examples matter?
Notice how none of these models relied only on one kind of data. Real market sizing is triangulation:
- Industry data,
- Some spreadsheet math,
- Customer surveys and interviews,
- Benchmarks from similar products,
- Sanity checks against competitors and adoption curves.
Essentially, you’re not hunting a perfect number. You’re proving you understand the industry dynamics, the particular audience behavior, and yes, the limits of optimism.
Conclusion
If you made it this far, you already know something many founders and business owners often skip. Market sizing isn’t a process to find some magic number.
It’s a process that helps you understand what your business is about to deal with.
Yes, the spreadsheets matter. Yes, TAM/SAM/SOM models and the bottom-up vs. top-down choice matter. Yes, being able to walk an investor through your logic without sweating matters.
But at the core, it is all about clarity.
Understanding the actual opportunities in your sector is how you make informed decisions, budget marketing strategies properly, and know how much revenue potential you’ve got (realistically).
FAQ
What is the difference between market size and market share?
Imagine your favorite cake.
Market size is the full cake. It is the total amount of money that could potentially be spent on products/services in your market during a specific period.
And a slice of it is market share. Something your company can realistically capture from the full cake.
Essentially:
- Market size is how big the opportunity is.
- Market share is how much of it you've won.
The mistake most people make is confusing these two terms. Especially early-stage founders who look at a massive TAM and think that's the money they'll actually make.
What is a good market size for a startup?
It really depends on what kind of business you're building. A startup looking for funding from investors needs a much larger market than a founder who just wants to run a niche business.
And that's completely fine, either way. A smaller market with low competition can be just as good of an opportunity as a massive one.
The key is not to look at how big the market looks on paper. Ask yourself whether the part you can practically capture is big enough to support the business you're trying to build.
How often should you update your market sizing?
The short answer: whenever something meaningful changes. That can be a lot of things. For example:
- A competitor enters or exits your market.
- You change your pricing.
- You expand into a new region.
- Industry report drops with new data.
- Your target audience shifts.
- You launch a new product.
Any of these is a good reason to revisit this question.
Most businesses make the mistake of updating only when they're raising money. But by then, you're chasing a number rather than understanding your market.
It doesn’t mean you have to update it every month. It simply has to reflect reality.
How is market size used in economics?
The meaning of market size in business and economics is different.
In economics, it is used to measure the total demand for a product/service within a specific region, period, etc. Essentially, economists use it to understand how industries grow over time.
All trademarks, logos, images, and materials are the property of their respective rights holders.
They are used solely for informational, analytical, and review purposes in accordance with applicable copyright law.