
GA4 Page Load Time Explained: Metrics, Methods, and Optimization Tips

Today, there is no shortage of web and YouTube tutorials on how to track page load time using Google tools. Open Google now and search for the keyword “GA4 page load time”. You’ll find dozens of identical how-to and step-by-step guides.
However, all these guides only scratch the surface of this topic.
Our post goes beyond generic recommendations. It will help you understand relevant GA4 metrics for measuring page load time reliably and give plenty of actionable optimization tips to enhance your site speed.
Buckle up! Let’s get right to it.
What is page load time in Google Analytics 4
Imagine two people measuring the same room — one using inches, the other using centimeters. Their numbers differ, but the space hasn’t changed. That’s what happens when teams discuss performance without aligning on GA4’s definition of page load time. Let’s make sure we’re using the same ruler.
Defining page load time in GA
Every team has an invisible contract about what “fast” means. Break that contract, and you get cheerful dashboards with grumpy users. One chart praises the first paint, another chart sulks over a late hero, and the UX video shows someone tapping, waiting, and developing new hobbies.
For practical reasons, it helps to distinguish three stages in what we consider a “load time”:
- Reassurance — Denoting the psychological moment known as “something is happening”. In Google’s Core Web Vital’s family, this moment is technically called First Contentful Paint (FCP), and for the user, it means that either a text or a graphical element first shows on the screen. In other words, it’s the reassurance moment, confirming that their click has produced a result.
- Substance — Meaning that the main thing that interests a user has appeared on their screen, i.e., fully loaded. It’s the substance of their request. It could be an image, a video, or a text. The Core Web Vital’s family calls this stage Largest Contentful Paint (LCP).
- Responsiveness — The stage when not only something is happening, and the substance has fully loaded, but the whole page has become responsive to the user's next actions. Google calls this stage Interaction to Next Paint (INP).
That simple hierarchy mirrors how people actually experience a page, not how a lab stopwatch does. We’ll come back further down the article to the key elements in Core Web Vitals and their descriptions.
🧭 In plain words: Page load time is the total duration between when a user requests a page and when that page becomes visually complete and interactive. It’s the measure of how quickly people can see and start using what they came for.
Here is a quick data-backed illustration:
When Interaction to Next Paint (INP) replaced First Input Delay (FID), lots of dashboards flinched. The Chrome User Experience Report (CrUX) shows that approximately 47% of website origins pass all Core Web Vitals (CWV), dropping to around 44% under INP — less flattering, more realistic. It didn’t make the web slower; it simply made the mirror clearer.
This is why definitions are not paperwork. They prevent good teams from chasing the wrong ghost — like compressing images when the real issue is a long main thread stuck wrestling a script. It keeps your “page speed” narrative stable as you ship, test, and compare your products.
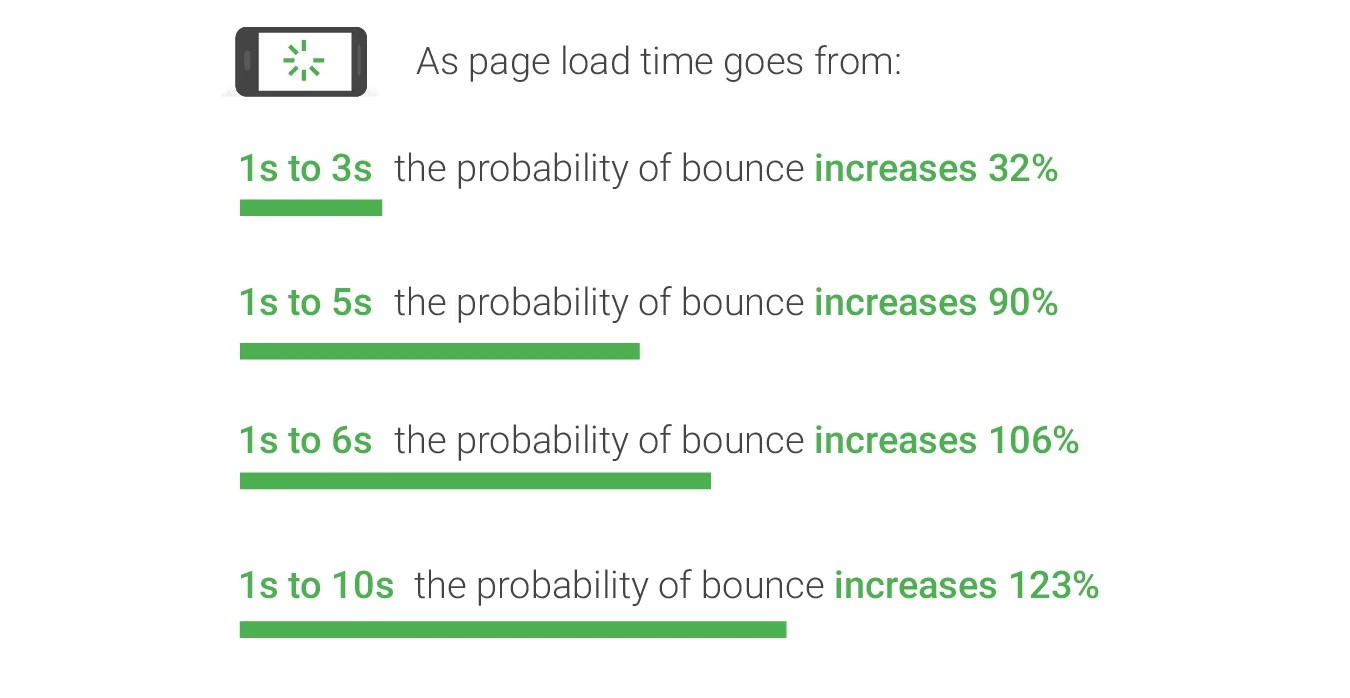
Source: Thinkwithgoogle
How GA4 measures page performance
GA4 collects what your users’ browsers experience. Contrary to popular belief, it doesn’t have a single “page load time” metric like Universal Analytics once did. Instead, GA4 measures performance indirectly — through events, browser timing data, and user interactions.
How does this process work?
When someone visits a page, their browser records timestamps for key milestones: when the page starts loading, when content first appears, when the main content becomes visible, and when the page responds to input.
GA4 collects these data points using a mix of the Performance API (built into browsers) and its own event model.
In other words, GA4 listens to what the browser experiences — not just what the server reports. That gives you a more realistic picture of how users experience your site, rather than how fast your backend is.
This knowledge of the user experience-focused GA measurements opens secret doors for you to improve your page load time.
Here is how:
- Give milestones a voice — record DOM Ready, LCP, or any other key moment as custom events so GA4 hears them clearly.
- Make data personal — turn timing values into custom metrics that reflect your idea of responsiveness.
- Zoom in where it stings — separate fast and slow experiences by device, region, or network type to see who’s waiting too long.
- Connect the dots, not the guesses — use BigQuery to see whether sluggish pages quietly drain conversions or patience.
- Compare layouts side by side — a blog post and a checkout page rarely suffer the same delays; treat them differently.
Once implemented, these small routines will significantly boost your page(s) load time. You’ll see which templates and routes lag, and which assets block rendering.
Besides, this will make prioritization easier for you, enabling you to fix the biggest bottlenecks for the broadest impact.
Differences between average page load time, FCP, and LCP
People say “load time,” but three different moments usually drive the conversation: when anything shows up, when the main thing appears, and when interaction feels snappy. Mixing them or oversimplifying everything into a single metric hides real problems.
Let’s define the three terms to avoid confusion:
1. Average page load time
This is a purely technical measure, which captures how long it takes on average to load a particular page. What it doesn’t capture is a user’s satisfaction.
However, in real life, users might react even sooner — when something appears (FCP) or when the main part appears (LCP). This is exactly why you may miss something really important (user frustration) when focusing solely on this technical measure.
Benchmark: Pages that load fully within 3 seconds or less are generally considered performant; beyond 5 seconds, abandonment rates rise sharply.
2. First Contentful Paint (FCP)
FCP = the first pixel that proves the page is alive. It could be a logo, heading, or background; whatever shows first. Fast FCP reduces the sense of a frozen screen.
Benchmark: ~1.8 seconds or less.
3. Largest Contentful Paint (LCP)
LCP times the center-stage moment when the main visual element has been rendered. This is the moment your site feels “ready” to visitors. Improving LCP usually means prioritizing key assets and render paths.
Good threshold: about 2.5 seconds; anything near or above 4 seconds is a problem.
To make the picture complete, here are some other related signals and their best uses. Knowing them will help you pick the right KPI for the job:
- Average load duration: broad pulse check; great to compare across releases.
- Interaction to Next Paint (INP): end-to-end responsiveness; curb long tasks and heavy handlers.
- Cumulative Layout Shift (CLS): visual stability; avoid late shifts with sizing and font strategies.
💡 FYI: CLS and INP all belong to Google’s Core Web Vitals. CLS measures how much a web page’s visible elements unexpectedly move while loading. INP captures how long it takes a web page to respond to all user interactions — not just the first one, as First Input Delay (FID) does.
When teams use the same terms, site speed work becomes straightforward prioritization instead of debate.
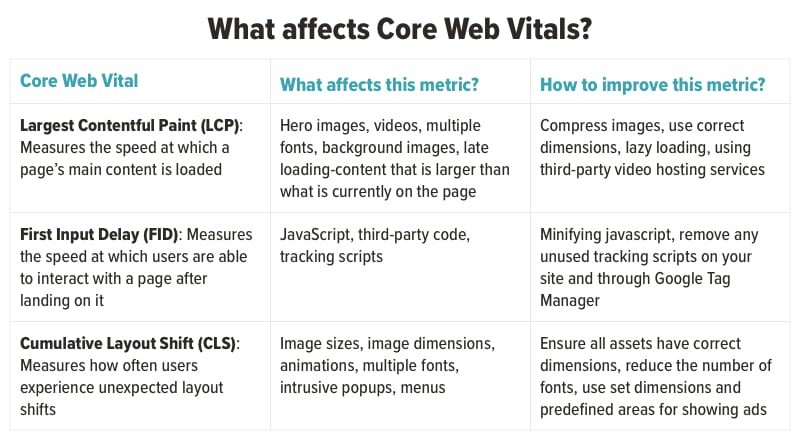
Source: Orbitmedia
How to measure page load time in GA
Understanding how quickly your pages load is central to interpreting real user experience. GA4 doesn’t automatically provide a “page load time” metric, but it gives you the tools to collect it manually — through events, custom metrics, and Google Tag Manager (GTM).
The process isn’t about adding another line of code; it’s about teaching GA4 to listen to what the browser already knows — when the page starts, when it finishes loading, and how long that took.
Setting up tracking
To measure how long your pages actually take to load, GA4 needs a nudge — it won’t collect this data by default.
What we’ll do is teach it to read the browser’s own timing diary. This diary, known as the Performance API, quietly notes when the browser started loading the page, when it painted the first pixels, and when it declared “all done.” We’ll use that information to send a custom event to GA4.
You don’t need a fancy dev setup — Google Tag Manager (GTM) is enough. Think of GTM as a translator that listens to the browser, rewrites what it hears into plain data, and then hands it over to GA4.
Step 1. Create a new tag in GTM
Open your Tag Manager workspace and start a new tag. Choose Tag type → Custom HTML.
This tag will act as a small script that lives inside your pages and keeps an eye on the load process. It’s your personal reporter taking notes on when each page actually finishes loading.
Step 2. Add the load-time script
The script we’ll upload is called custom JavaScript. Here is how it looks in the Tag Manager’s menu:
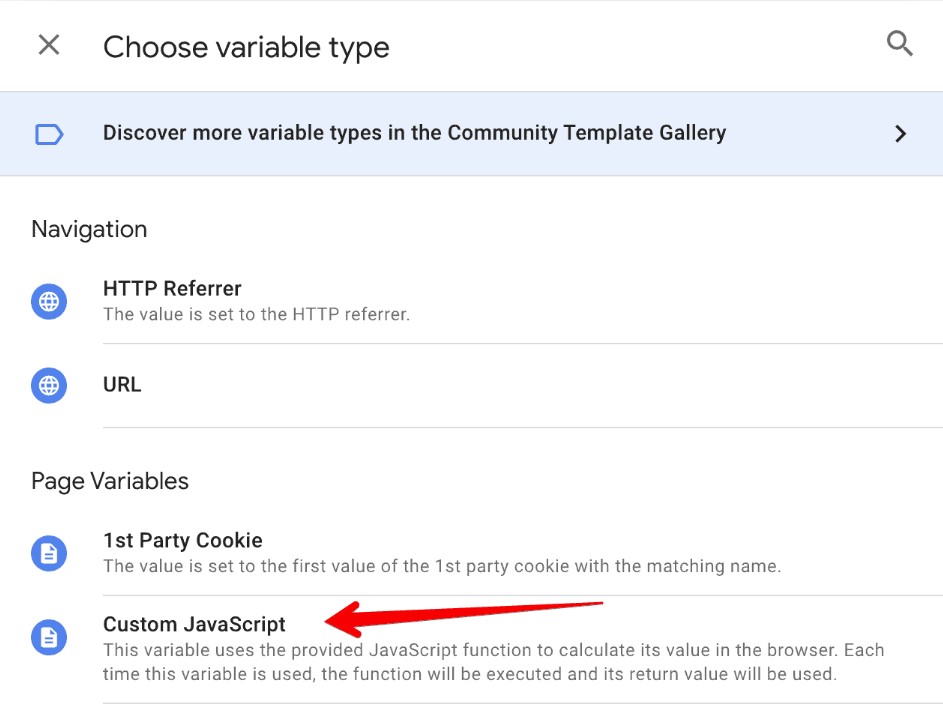
Source: Measureschool
Paste in the following code:
<script>
window.addEventListener("load", function() {
const timing = performance.timing;
const loadTime = timing.loadEventEnd - timing.navigationStart;
dataLayer.push({
'event': 'page_load_time',
'page_load_time_ms': loadTime
});
});
</script>
Here’s what it does:
- It waits until the page has finished loading (load event).
- It calculates the gap between the moment the page started (navigationStart) and the moment everything finished (loadEventEnd).
- It pushes that number (in milliseconds) into the dataLayer, which is GTM’s message board.
So instead of guessing or relying on a third-party speed test, you’re recording what real users’ browsers are experiencing.
Step 3. Tell GTM when to fire
The GTP tag won’t fire by itself; you need to create a trigger. When you do it, All Pages is the usual choice.
That means every page visit will whisper its load time into your dataLayer. You could also narrow this down (for example, just key templates or landing pages) if you want to avoid noise.
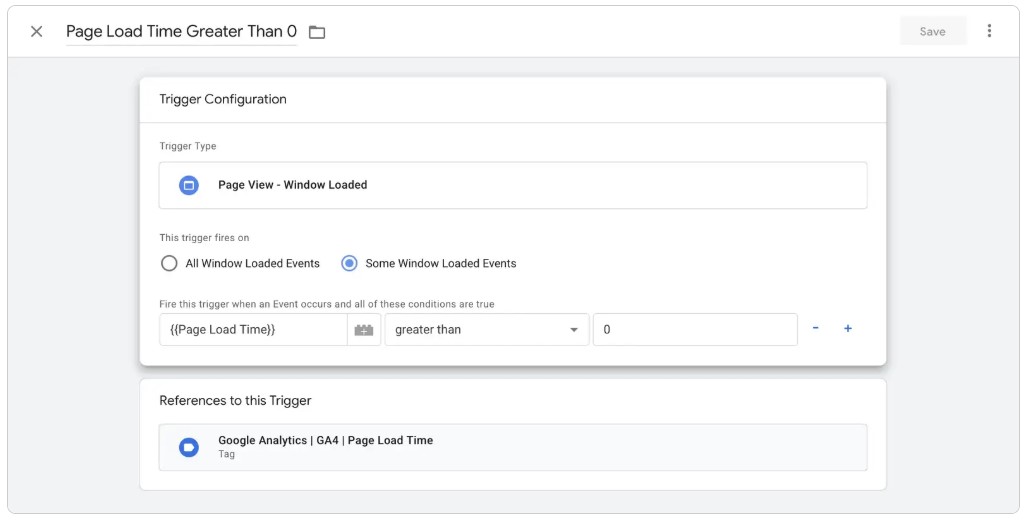
Source: Lovesdata
Step 4. Create a GA4 event tag
Now we need to pass that new information to GA4. Just follow this sequence of actions:
- Create another tag: GA4 Event.
- Set the Configuration tag to your measurement ID (the same one GA4 uses).
- Event name: page_load_time.
- Add a parameter:
- Parameter name: load_time_ms
- Value: {{page_load_time_ms}}
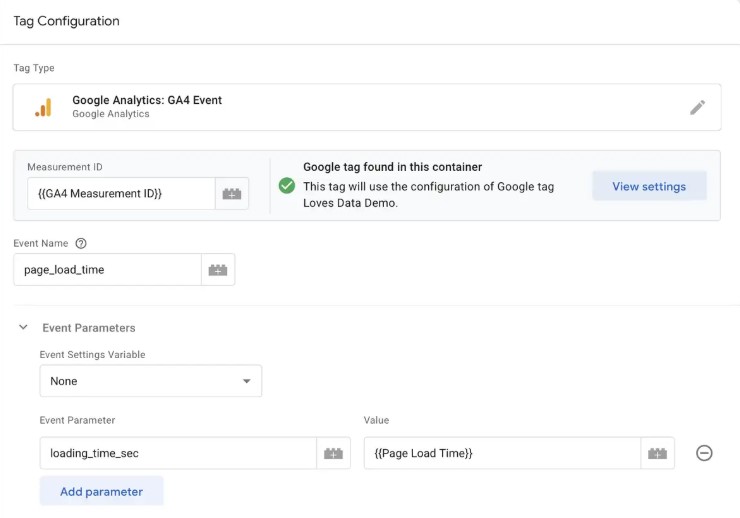
Source: Lovesdata
This connects the browser’s raw timing data to GA4’s reporting layer. In plain terms, you’re teaching GA4 to listen to what the browser already knows — when a page truly feels ready for users.
Step 5. Make the variable
The parameter above depends on a variable we haven’t defined yet.
- Go to Variables → New → Data Layer Variable.
- Name it page_load_time_ms.
- Under “Data Layer Variable Name,” type the same: page_load_time_ms.
Basically, this prompt tells GTM, “Whenever you see that value in the dataLayer, grab it.”
Step 6. Publish your setup
Click Submit → Publish in GTM. The new tags go live immediately, and the stopwatch starts ticking for every visitor.
After some traffic flows in, open GA4 → Reports → Events → look for page_load_time. You’ll start seeing numbers like 2100 ms, 3200 ms, and so on — real load times in milliseconds.
Step 7. Test before you trust
Always test in Preview Mode first. Load a page and check that:
- The page_load_time event fires.
- The page_load_time_ms variable shows a real number.
- The tag sends data to GA4 without console errors.
A healthy test looks like this: page_load_time_ms = 2400, meaning that the specific page took about 2.4 seconds to finish loading.
Once you confirm it works, you can repeat the setup for different templates or sections — homepage, product pages, blog posts — to see how load times vary across your site.
🧭 In plain words: What you’ve built is a small, reliable bridge between the browser’s stopwatch and GA4’s event system. Every page now quietly reports how long it took to become usable — no external tools, no synthetic tests, just the real story from your users’ screens.
For example, if your homepage reports page_load_time_ms = 2500, that means the full document loaded in 2.5 seconds. You can later average these values in GA4 Explorations to compare page types or device categories.
Best practices for setup
Setting up measurement is only half the job; keeping the data believable is the harder half. GA4 happily records what you teach it to, so the discipline lies in feeding it the right cues. Treat this like tuning an instrument — accuracy comes from attention, not automation.
A few steady habits worth adopting to boost your GA4 page load time:
- Track in milliseconds, think in patterns. Small timing shifts say more than big spikes.
- Name your events with intent. page_load_time is better than “timing_1” — clarity outlives memory.
- Segment by environment. A dev server and live traffic should never share the same averages.
- Compare families of pages. A homepage behaves differently from a cart page — don’t average them together.
- When validating, put on your favorite skeptic glasses. Check DebugView, network logs, and the actual event payload.
- Filter data only when required. Keep the raw feed intact; make your filtered views inside reports, not the tag.
- Use BigQuery as a diary. Store the raw numbers somewhere they can’t be overwritten.
- Connect timing to feeling. Match milliseconds with bounce rates, time on page, and other top metrics; numbers mean more in the company.
When pursuing a better site speed, GA4 rewards curiosity more than compliance; keep poking at your data until it starts making sense beyond the graphs.
🧠 Pro tip: Give every site a “worst-case” tag — a purposely heavy page you can monitor. If even that stays stable, the rest will follow suit.
Interpreting GA4 page load time data
A common mistake that newcomers to Google Analytics make is to find one number, often an outlier, and overemphasize its meaning. And even a more serious mistake is to jump to conclusions based on that single number.
Page speed data interpretation is more about consistency and finding patterns in that consistency. In this chapter, we’ll tell you how this can be done in practice.
Identifying slow pages and regions
Upon first look at the GA4 data, you’ll see that your reports are full of signals. Your job is to group them into patterns and use those patterns to draw conclusions backed up by data.
The aim is to focus on what’s slow, who it affects, and whether the changes will help.
Keep the language plain. “This page, in this region, on this device” should be preferred over any grand theory.
Long story short, begin with templates because structure drives weight. Then look across regions; distribution and caching can change the picture, impacting site speed.
If the same template is slow everywhere, it’s a design or code issue. If it’s slow in one place, think about routing and edges.
Checks that reveal the pattern (so you can act fast):
- Template medians and p75 side by side.
- Region deltas for the same template.
- Device and connection overlays.
- Asset count and size, focusing on hero and fonts.
- Third-party presence mapped to slow pages.
🧩 Example: Your product pages load fine in the USA, but stall in Brazil. The culprit: an oversized hero image served from a distant CDN edge. Compressing that asset and enabling a closer edge location drops the load by 900 ms.
The outcome you want is a ranked list of issues, not a pile of theories. Start with pages that get the most traffic; improvements there pay back immediately.
🧠 Pro tip: Create a “suspect list” dashboard: top 10 slow pages per device and per country. Investigate two items per week; you’ll learn faster than boiling the ocean.
Correlating load time with engagement
We improve performance to support behavior, not to admire numbers. User experience and satisfaction — these things matter the most, and even search engines like Google and Bing reward sites that can keep their visitors satisfied and engaged.
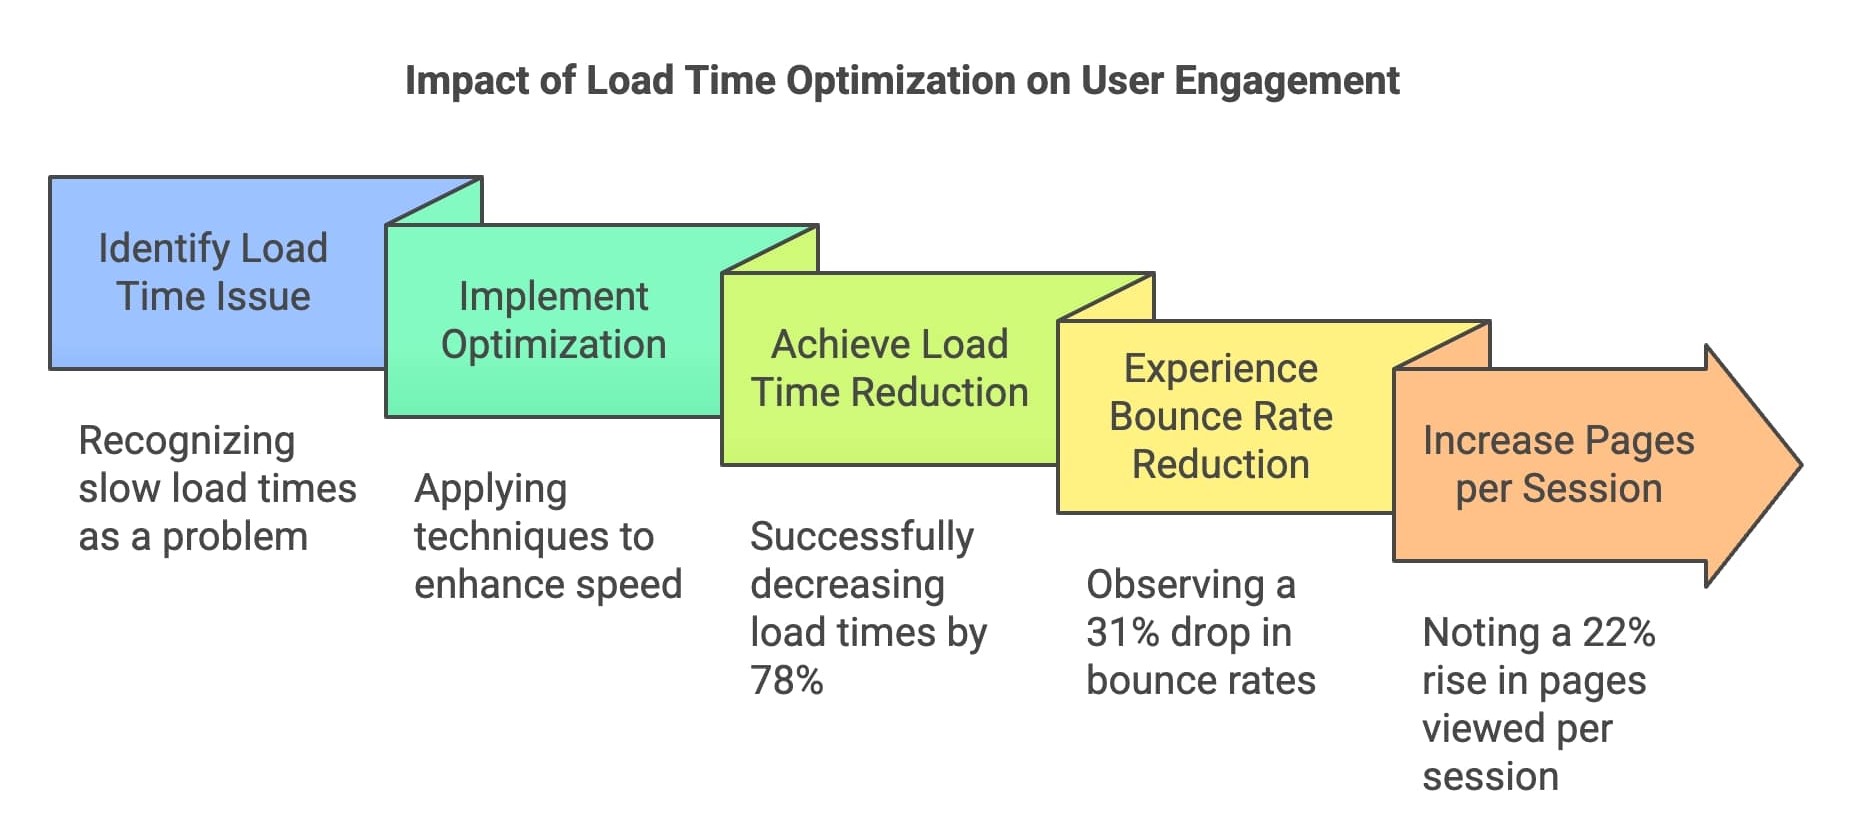
Source: Seomator
What does it all mean for you in practical terms in GA? First, you should compare page load performance with the actions that matter on each template. Avoid over-modeling. Simple cohort comparisons are always easier to read and defend.
Consider these useful correlations (to justify your effort):
- LCP quartiles vs. product click-through.
- INP quartiles vs. CTA activation on mobile.
- Load distributions vs. bounce per device.
- Country-level load vs. time on task (e.g., form completion).
- Pre/post change comparisons aligned to deploy timestamps.
🧩 Example: Lowering LCP from 3.4 s to 2.5 s on product pages lifted “add to cart” by 4.1%. Same traffic, different patience curve. That’s GA4 page load time speaking in plain economics.
If the link looks weak, your segmentation might be off. Try isolating mobile, older devices, or specific campaigns, because signals often hide in the edges.
Once you have a pattern, create a small scoreboard, comprising the metric, the goal, and the owner. The responsible person should be held accountable for both the successes and the failures.
🧠 Pro tip: Present results as “delta per 500 ms.” Stakeholders remember simple rules of thumb better than dense regression outputs.
Establishing performance thresholds
Pick achievable targets (KPIs) that you can not only track and reach, but also sustain in the long run. Remember, good thresholds are memorable and repeatable.
Then write them where decisions are made: design specs, backlog templates, and PR checklists.
Here are some examples of practical thresholds:
- LCP target ≤ 2.5 s; investigate ≥ 3.0 s; urgent ≥ 4.0 s.
- INP target ≤ 200 ms; investigate ≥ 300 ms; urgent > 500 ms.
- CLS target ≤ 0.10; investigate ≥ 0.15; urgent > 0.25.
- Asset budgets per template (hero ≤ 250 KB).
- Alert on median load worsening >15%.
🧩 Example: When a marketing script ran during initial loading, it stalled the page’s main content and increased the LCP to 3.2 seconds. Adjusting the setup so the script loaded only after a user’s first interaction reduced delays and stabilized conversions.
Thresholds don’t replace judgment; they focus on it. Marketing and IT teams move faster and work smarter when the guardrails are obvious.
🧠 Pro tip: Add thresholds to code review checklists; it prevents page speed regressions from sneaking in through “just one more script.”
Optimization tips to reduce page load time
Improving speed is less a sprint and more a tidy sequence. In this chapter, we’ll show you how to reduce weight, optimize navigation paths, and trim unnecessary clutter to make your pages perform and feel more agile.
As you work on GA4 page load time, remember that perception starts early, and it weighs much more than your technical performance data can show. If the first view is quick and interaction feels instant, people forgive a lot in the background.
Technical improvements
Not all bottlenecks are equal. We start with the fixes that travel well across pages: images, resource order, compression, and the way assets reach the user. These changes turn into fewer bytes, simpler render paths, and calmer main threads.
Treat your templates like different species. A lightweight article and a complex checkout do not fail in the same way. The methods below apply to both, but you’ll apply heavier pressure where it matters most.
1. Optimize images
Start where the bytes live. Convert large images to WebP or AVIF, and right-size them for actual containers. It’s the easiest path to smoother first impressions.
Keep an eye on content workflows. If authors upload huge files, your gains leak away. Set guardrails, not guilt.
2. Implement lazy loading for below-the-fold content
Only fetch what the user can see. Lazy loading keeps the first screen lean and lets interaction start sooner. It’s especially helpful on image galleries and long lists.
Use Intersection Observer instead of scroll hacks. The browser knows what’s visible; trust it to tell you when to load.
3. Minify CSS, JavaScript, and HTML
Minification removes the padding that machines don’t need. The payoff is smaller transfers and faster parsing. It’s simple and predictable.
Combine with tree-shaking for JavaScript. In web development, less code often means more than parsing faster code or stuffing more code into a single element.
4. Leverage browser caching and CDN delivery
Caching helps your pages preload and display frequently used or heavier elements faster. Whereas a Content Delivery Network (CDN) places files where users actually are. The duo can lift page speed without touching a line of product code.
Version files with hashes and give them long lifetimes. For regions with lag, add or adjust edges; geography matters more than we admit.
5. Use server-side compression
Compress text assets at the server. Brotli compression standard usually wins, but either choice beats raw bytes. You’ll notice the difference most on slower networks.
Finally, before you launch any site version or one of its core elements (with a heavy impact on page load time), verify compression in your browser’s network panel.
6. Eliminate render-blocking resources
Some files act like traffic cops at the top of your page — nothing moves until they’re done waving things through. Keep only the CSS needed for the first screen inline, and let the rest load once the page is visible.
Give your JavaScript some manners with defer or async so it doesn’t hold up the view. For fonts, preload only what users see right away, and use font-display: swap so text shows instantly, even if the custom style takes its time.
💡 The bottom line: The changes we’ve described in this chapter are small and dependable. Together, they will help reshape the perception of your site visitors to the point where they’ll want to stay longer.
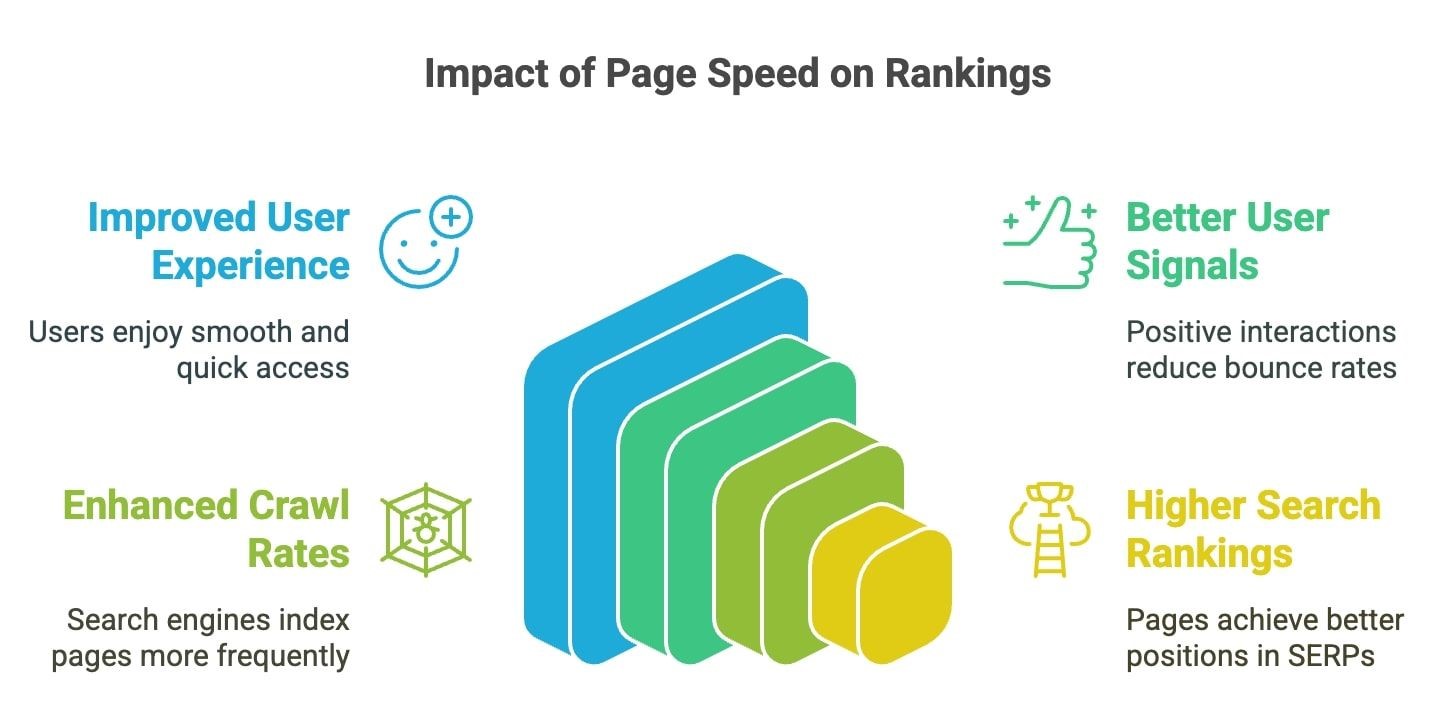
Source: Seomator
Continuous monitoring
Speed degrades in small, forgettable steps. Many site administrators don’t notice the problem until it's rather late, and the damage to the site’s reputation has already been done. Don’t be among those and learn the hard way that reputation is cheaper to maintain than to repair (some damage cannot be repaired at all).
The solution? A simple monitoring loop that catches drifts and links them to real templates.
Make the numbers approachable. If one page looks worse, owners should know how to check and how to act.
1. Monitor Core Web Vitals in Search Console and GA4
Field data shows real user experience; GA breaks it down by page and device. Together, they explain both “how often” and “where.” Focus on LCP and INP for the pages that drive revenue or signups. That’s where attention matters most.
2. Set automated GA4 alerts for performance degradation
Configure alerts when percentile thresholds exceed targets, and route them to owners. Keep messages actionable, e.g., page, metric, and size of change.
Include an average in the alert for context, but use median or p75 as the trigger condition. It keeps alarms practical.
3. Compare pre- and post-optimization reports
Match apples to apples by using the same template, device, and region in every repeated measurement. No matter how strong the desire to make better measurements and introduce new metrics, your pro- and post-optimization reports should speak the same language.
Otherwise, how would you know that the changes you made worked?
If improvement is small, check cache warm-up, image formats, or script order. The fix might be a one-line change.
4. Use PageSpeed Insights or Lighthouse for recurring audits
Use these tools to catch render blockers, long tasks, and unused bytes. Make sure you cross-check with field symptoms before prioritizing any optimization actions.
And when it comes to prioritization, fix the items that match user complaints first. The rest can wait.
💡 The bottom line: Continuous monitoring ensures your page always stays in the best shape possible, sustaining high levels of user engagement. Share outcomes, not only metrics. “Faster product page” means more than “better score.”
For the optimization loop, keep it narrow: accurate check, informed decision, fast shipping. Performance lives in that rhythm.
Conclusion
In the end, speed is about trust. People trust pages that appear when they expect them to. GA4 just helps you count that trust in milliseconds.
If you remember one thing, make it this checklist:
- Treat speed as part of UX, not a side quest.
- No site is fast for everyone, everywhere.
- Optimization is never about perfection, only direction.
- Small fixes stack faster than grand rebuilds.
As Peter Drucker once put it, “What gets measured gets improved.” Do it at your own pace and with the metrics that your page (site) needs at this exact moment, and optimization directions will be much easier to see.
The beauty of GA4 page load time is how it turns invisible friction into visible progress. Once you see it, you’ll never design blind again.
FAQ
How to find page load time in Google Analytics?
Google Analytics (GA4) doesn’t track a single particular page’s load time by default. But you can configure it to do so. Just set up a custom tracking (custom event, e.g., page_load_time) script via Google Tag Manager (GTM), which will calculate page loading time in milliseconds. Once set up, you can find your page load time under Reports → Events.
What is a good page load time?
While there is no universally accepted and fixed measure of a good page load time, most web pages today open under 3 seconds. An excellent load time is something between 0 and 2 seconds, and anything above 3 seconds is considered a bad load time.
What is the formula to calculate loading time?
The formula to calculate page load time is: Page Load Time = loadEventEnd - navigationStart. Essentially, a page load time is calculated by finding the difference between the above two key browser timestamps (loadEventEnd and navigationStart) in the Performance API.
Is page load time a KPI?
Yes, it’s a business-critical KPI that allows websites to understand how users will experience their pages. Too long a load time, and users will bounce. Short load time, and no one will even notice this metric—that’s the reality of the modern-day web. When something works as expected, you won’t get praised.
All trademarks, logos, images, and materials are the property of their respective rights holders.
They are used solely for informational, analytical, and review purposes in accordance with applicable copyright law.