
Perceptual Map Marketing: A Beginner’s Guide to Brand Positioning

Perceptual map marketing may sound scary, but in reality, it is very intuitive and not difficult to understand. Moreover, out of all brand positioning instruments out there, it is one of the most common.
If you are not using perceptual maps in your marketing team sessions yet, you are giving your competitors a free advantage.
Read this guide carefully today to close this competence gap and give your brand strategy one additional tool that turns perceptions into actionable positioning insights, aligning your branding with what buyers truly value.
Understanding the basics
Before we dive into practicalities, let’s review the basics. In the term “perceptual mapping,” the word “perceptual” may intimidate many beginners; however, this is akin to a childish fear in the marketing world that we will dispel right away.
What is perceptual map marketing?
A brand perception map translates customer opinions into a picture. You put two relevant dimensions on the axes, place the competitors, and see patterns you can act on. The aim isn’t artistic; it’s alignment between customer reality and your plan.
A perceptual map reflects your customers’ perceptions of you as a company, as a corporate or personal brand, your products, or services. It's easy to collect data for, easy to plot, and even easier to understand, since visual information is what humans enjoy consuming (maybe too much — thanks, YouTube).
📌 Key note: This tool matters in business because perception drives choice. In 2024, the Edelman Trust Barometer reported that 84% of people say they need to share values with a brand before buying, which is another way of saying perception is not a nice-to-have; it’s decisive.
Perceptual map marketing helps you understand why some brands win attention while others blur together. It forces hard, evidence-based choices instead of fuzzy promises grounded in gut feelings.
Here’s a quick way to explain it to a teammate. Just start by saying, “It’s a…:
- Simple chart showing how customers see your brand.
- Visual snapshot of where you stand against competitors.
- Diagram that reveals market gaps and overlaps.
- Map of brand perceptions on two chosen dimensions.
- Way to plot what buyers believe, not just what you claim.
- Quick picture of strengths and weaknesses in the market.
- Chart that turns survey data into something easy to read.
At the same time, a perceptual chart, no matter how good and accurate it may be, won’t replace product work or pricing strategy. It will, however, show where your story is believable. With perceptual map marketing, you go from abstract positioning statements to a concrete, defensible place on the map.
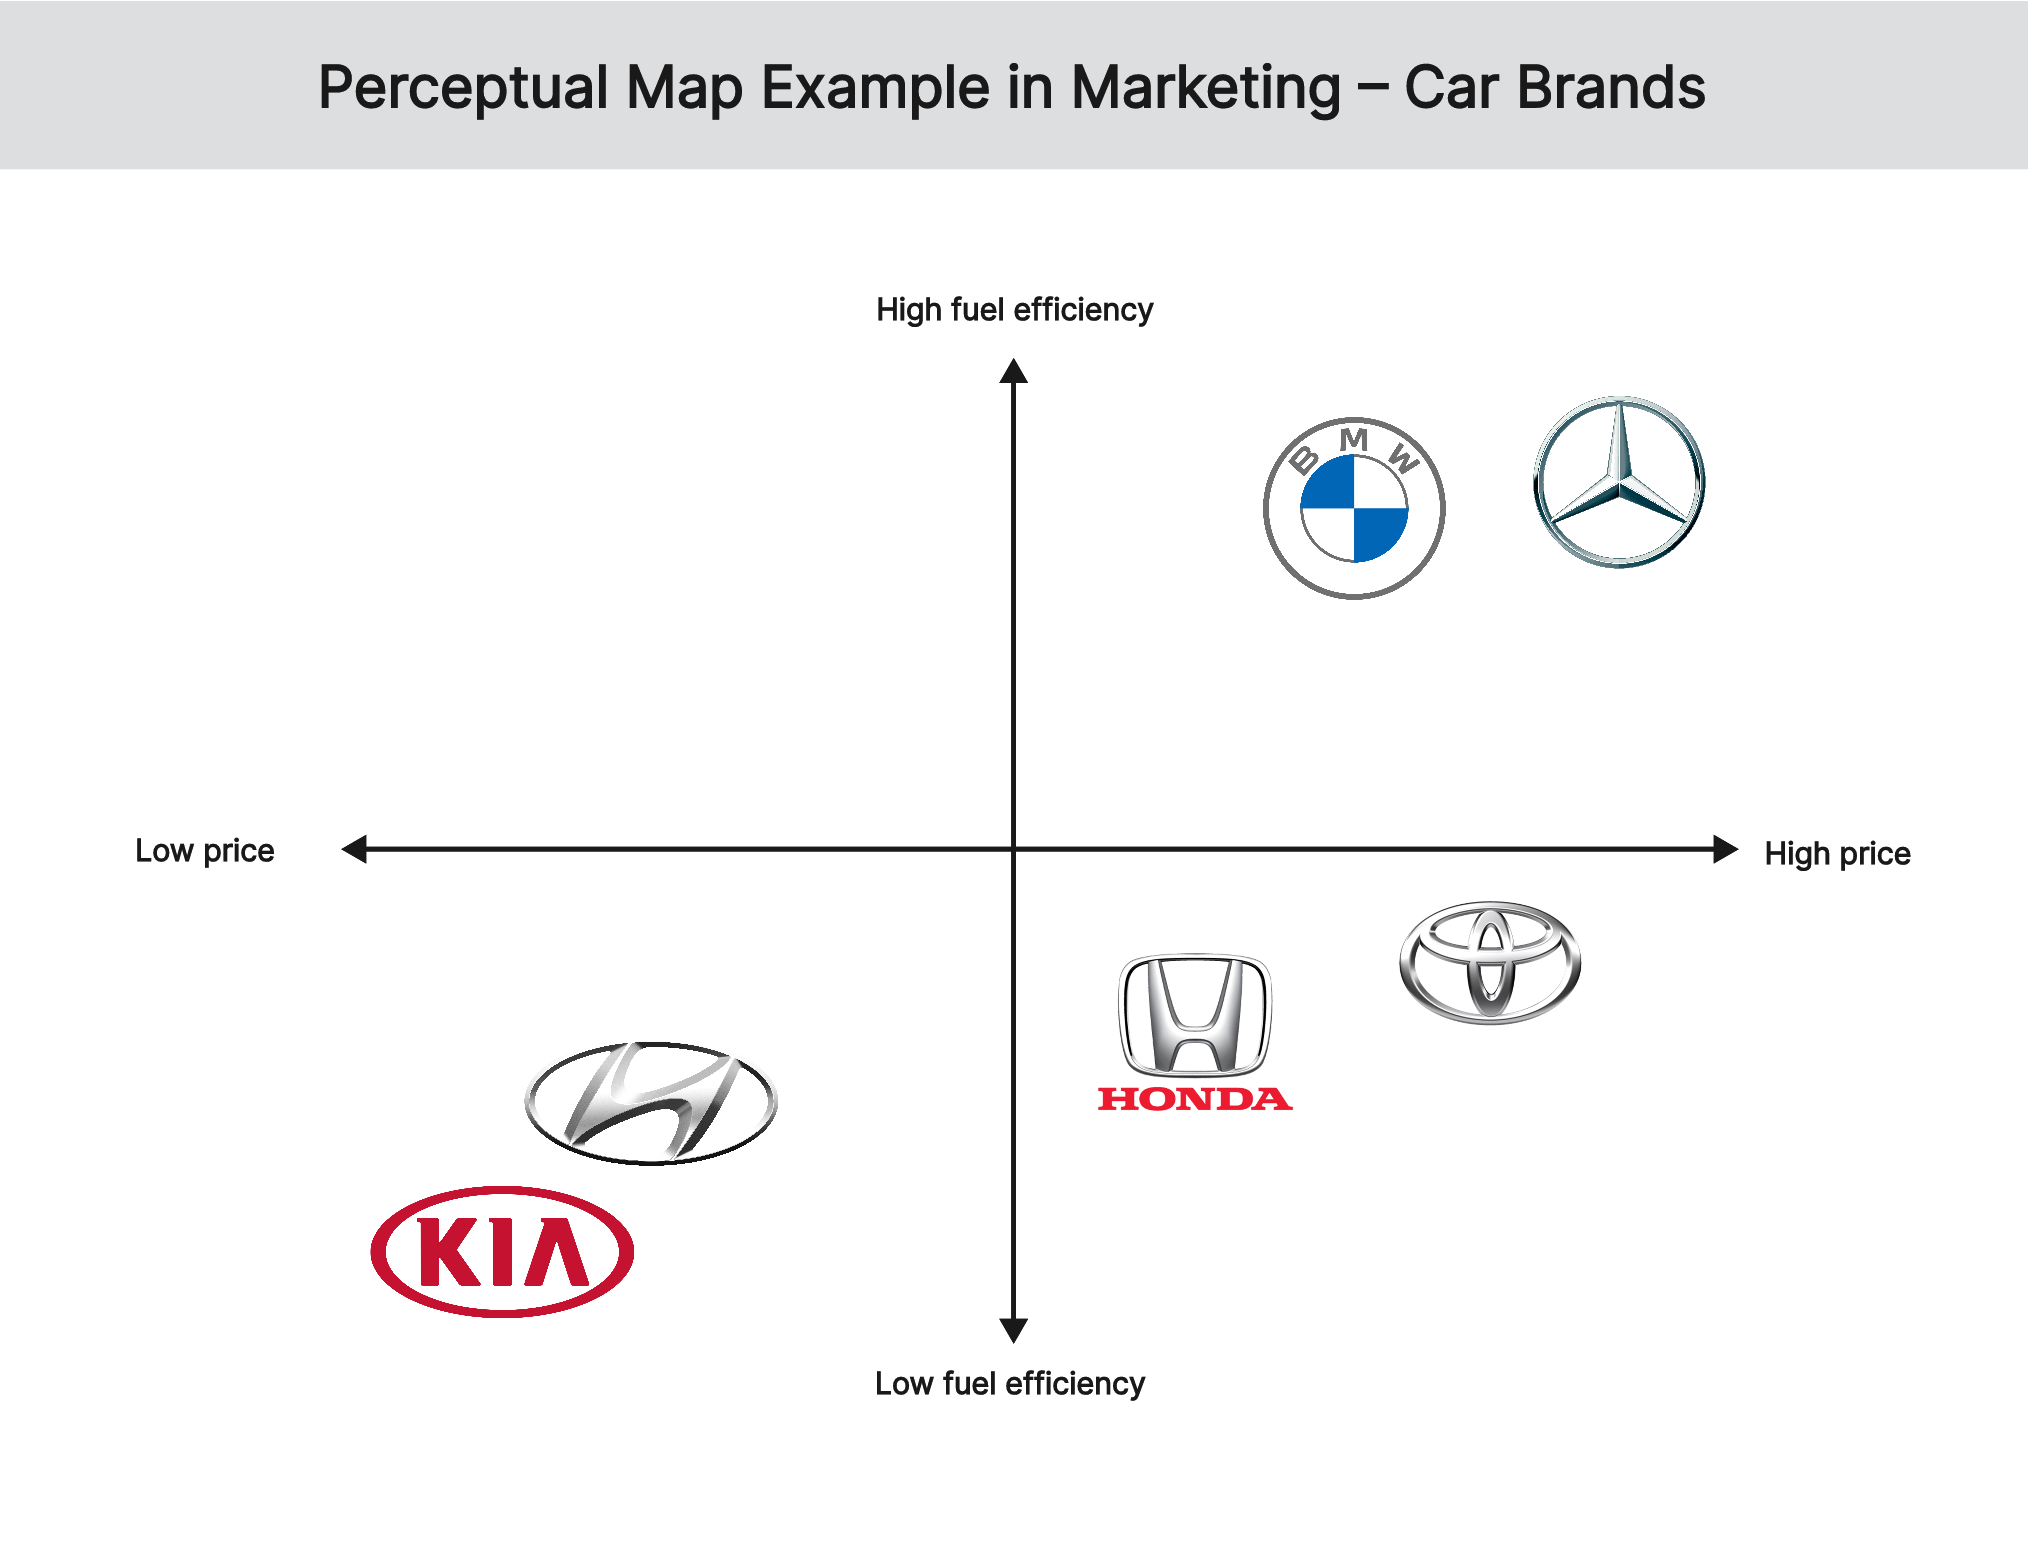
Source: Boardmix
📝 To remember: other frequently used terms to denote the same concept are: perceptual positioning map, market positioning chart, perceptual chart, brand perception map, competitive positioning diagram, brand differentiation map, to name a few.
History and origin of the term
The roots of perceptual maps don’t trace back to the drawing boards in college or MBA classes, as some might think. They come from psychology and statistics, where researchers developed methods to map how people compare and distinguish items.
Over time, marketers used these ideas to illustrate how consumers place products in their minds. Essentially, they borrowed the tool from psychology, just like they did with the famous Maslow’s Pyramid of Human Needs.
📌 Key note: The biggest shift, however, was turning the map into a decision tool. Instead of discussions and celebration of achievements, the teams moved to concrete actions. As a result, executives and creatives can now align quickly around how a category looks and where a brand might move next.
Here’s a short timeline showing how the idea became a practical tool:
- Academic visualization of perceived distance — Researchers mapped how people judge similarity, making invisible perceptions visible.
- Early adoption by marketers for brand comparison — Marketers used those maps to compare brands and spot clear differences.
- Classroom staple in research and strategy programs — Schools taught mapping as a core research skill for positioning and strategy.
- Everyday utility for workshops and roadmaps — Teams use simple maps in workshops to plan moves and priorities.
The biggest benefit of perceptual map marketing is that it makes strategic positioning intuitive. You see where you crowd competitors and where whitespace might exist. Strategizing and positioning your brand on the visual map is much easier than in one’s head.
This is how perceptual maps came to be and why they became a tool of choice for busy marketers and executives.
Why perceptions matter in branding
Branding is not something you do with your hands or physically; it’s a mental exercise, the one we do in our minds. Furthermore, branding requires envisaging things, so one must have a good imagination to position a brand for success.
This mental and even spiritual (as engagement is always part of the branding activity) nature of branding is what makes it a perfect “client” for perceptual mapping.
When a developed imagination and creativity combine with a simple visualization tool, we achieve a perfect marketing solution and a framework for turning abstract ideas into business realities.
Perceptions also shape how people answer the fundamental question every brand faces: what is this product really about? Here, we’re not talking about what it takes to build a brand, nor its features or specifications. Rather, about emotions, values, and expectations — all tied to the brand.
A strong perception ensures that when customers think of your product, they connect it with a clear promise and a unique identity in the market.
This is why perceptual mapping becomes more than just an analytical exercise. It helps uncover gaps between what is currently perceived and what the brand aspires to communicate.
📌 The bottom line: By aligning creativity, data, and imagination, businesses can refine their product positioning, strengthen messaging, and make their brand story resonate with both logic and emotion.
Building a perceptual map
Perceptual map marketing happens on drawing boards (conventional or electronic), and that’s a highly practical exercise. It takes some skills, good knowledge of the market conditions and your brand’s situation, and a significant amount of experience.
In this chapter, we’ll explain how to do perceptual mapping, starting with the basic things like the key elements and data collection, and going all the way to creating a map step-by-step.
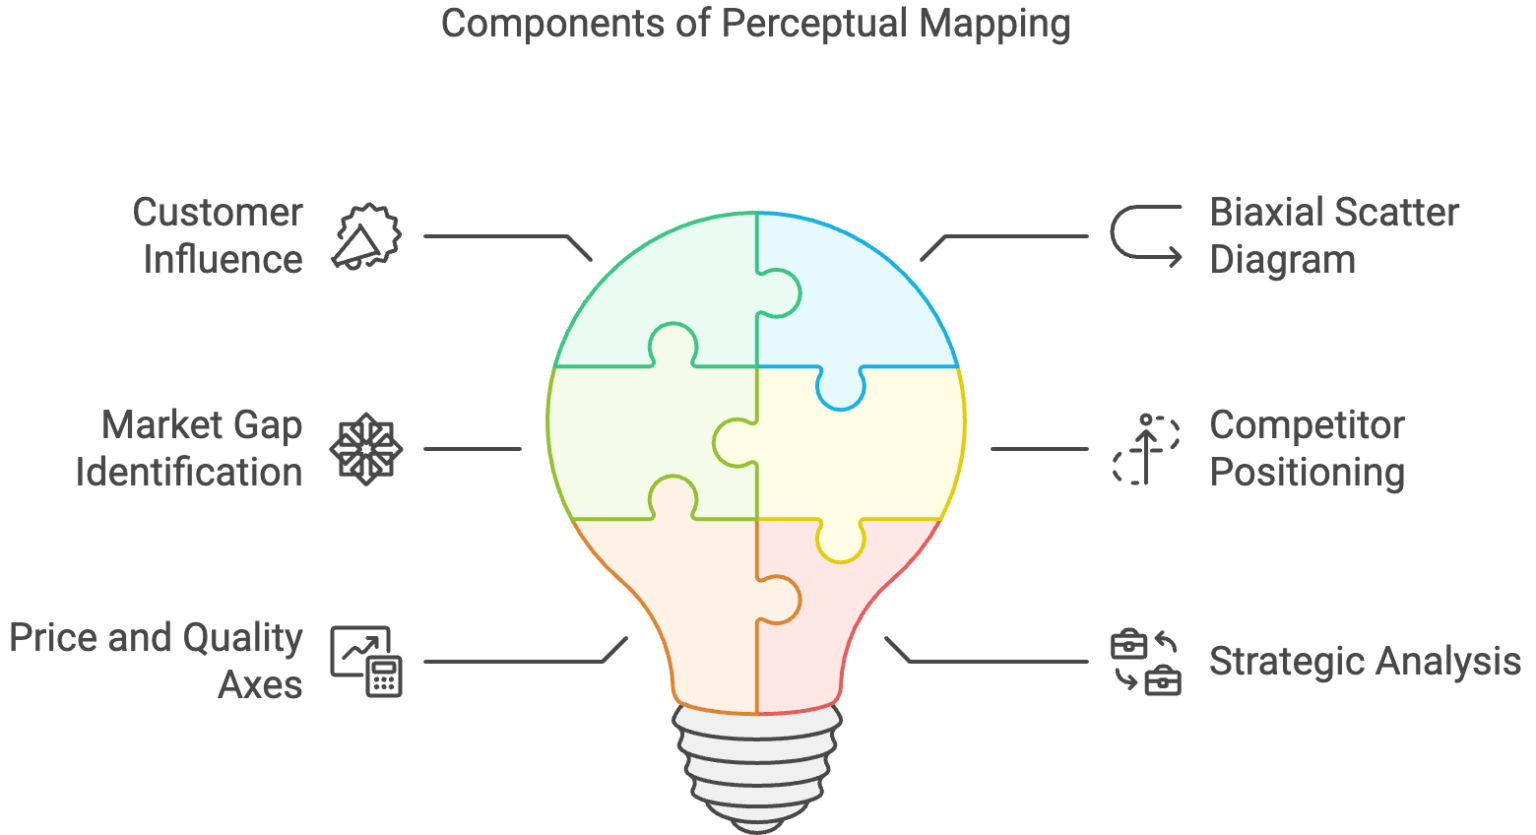
Key elements of a perceptual map
Think of a perceptual map as a clear window into buyer memory. It reveals how people file brands in their heads and why some stories stick.
One essential drawback is that the data for perceptual maps is deeply rooted in people’s emotions and can vary based on marketing campaigns, seasonal market shifts, and competitors’ activities. So, make sure you choose the data collection phase wisely, and align it with what matters to your brand.
Source: Prnewsio
A practical workaround is to use a positioning map as a tool that links narrative to evidence. When product truths and marketing claims meet on one page, teams align faster.
Build on these core blocks:
- Whose perceptions you reflect (real audience).
- Which competitors matter in that story?
- Plot two axes that reflect how buyers truly compare options.
- Opt for simple scales and labels that feel human.
- Make notes that explain clusters and exceptions.
Avoid ornate visuals. The goal is not to impress and stun with the design, but to accurately display the customers’ choices. For that same reason, the strongest brand perception maps are spare and readable.
When presenting the map to your team, write a one-paragraph caption that tells the same story the map is hinting at. That will help you keep marketing and product decisions moving in the same direction.
Choosing the right dimensions
In perceptual mapping, axes are your story spine. Borrow buyers’ words and keep them intact, so meaning doesn’t drift.
It’s also important to stick to the defined measurement units. For example, if you measure brand perception on a scale from 0 to 10, you shouldn’t alter or exceed the upper limit. Similarly, if you gather responses in a Likert scale, keep the same wording for all brands.
Source: PlanIO
Similarly, choose a category that meets the current business demands. From price, quality, innovation, customer service, etc., choose two that create contrast and independence. If “innovation” and “feature velocity” behave like twins, keep one.
Here is a quick litmus test for you:
- Would a customer nod at the label?
- Can we gather data without gymnastics?
- Does the pair spark an obvious discussion?
- Does it help us choose?
If yes, you’ve likely found your best pair of measurements to plot them clearly across both the horizontal (x-axis) and vertical (y-axis) dimensions of your perceptual map.
Collecting data for the map
In mapping customers’ perceptions, it’s important to blend both breadth and depth. Here is a simple breakdown of which tool to use and when:
- Short interviews for language cues.
- Compact pulse survey for ratings.
- Competitor research to anchor claims in what’s public.
Use surveys, focus groups, and competitor research in a simple order, i.e., step-by-step. Stamp the map with the sample and dates, so future readers don’t overgeneralize.
Surveys must be fully representative of your target audience. If you ask one person here and three people there, the results collected won’t show the real picture. Either hire a survey specialist in your team or contract a company for whom surveys constitute bread and butter.
📌 Pro tip: Check out Qualtrics, IBM Kenexa, Formstack, and similar consulting agencies that can not only organize and conduct surveys, but also analyze the results and help you make sense of the data. They know how to present findings to the management teams and help you plot customer answers on a perceptual map.
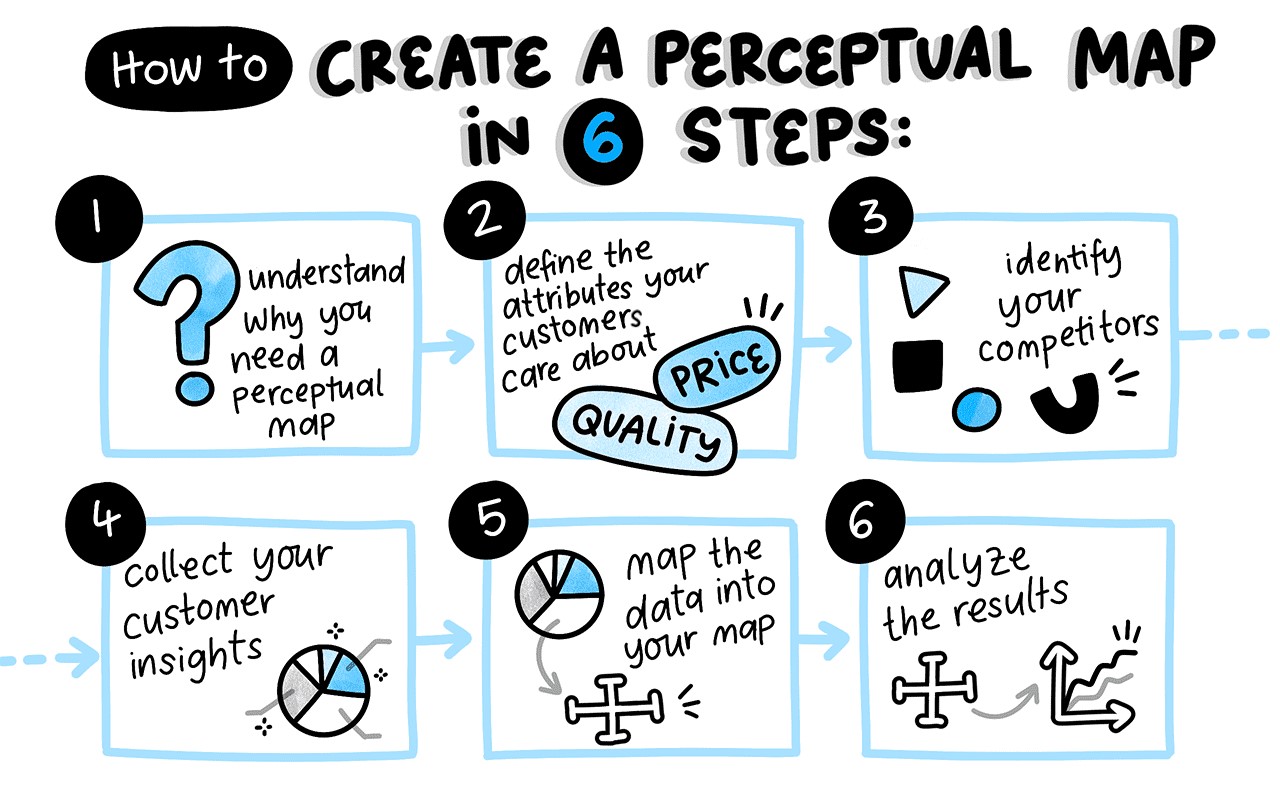
Creating a perceptual map step by step
You asked for a practical how to that fits into perceptual map marketing. The flow below works for a software product or a physical product, with a simple example (budget espresso machines).
Step 1. Frame the decision and scope
Write one sentence that states the decision (“Which value lane can our entry-level machine credibly own?”). List the brands buyers actually compare. Define the audience and region. Capture success criteria such as “identify one whitespace and two message angles to test.”
This prevents scope creep later and keeps the map tied to a business choice rather than curiosity.
Step 2. Elicit buyer language for candidate axes
Interview 6–10 target buyers. Ask them to compare options out loud and probe, “What is decisive when you choose?”
Listen for trade-offs like price vs. quality, ease vs. control, and customer service expectations. Translate verbatim phrases into candidate axes without rewording them. You’ll end up with a shortlist like “taste consistency,” “learning curve,” and “ownership cost.”
Step 3. Quantify perceptions with a lean survey
Field a short survey where qualified respondents rate each brand on candidate dimensions using simple 1–7 scales. Add one forced-choice per dimension (“Which brand feels most innovative?”) to sharpen separation. Ensure respondents have recent category exposure. Clean inattentive responses.
You now have continuous and categorical signals that are easy to plot and explain to non-research stakeholders.
Step 4. Select axes and label like a guest would
Pick two independent dimensions with the sharpest contrast, normalize scores, and label ends plainly (“Less manual operation (higher autonomy)” ←→ “More manual controls”). In the example, ‘taste consistency’ vs. ‘ease of use’ often separates traditional manual models from newer budget-friendly automatic machines.
Step 5. Plot, annotate, and turn into decisions
Plot points, mark clusters like “design-first,” and note surprises (“high quality feel at moderate price”). Review with marketing and operations. Choose one story angle to test, one guest segment to court, and one service ritual to refine. Add a small methods box so the picture and its limits travel together.
Close your preparatory work (presentation) with a short caption in natural language. Stakeholders should grasp the story without a meeting. And when they read your send-out materials prior to the meeting, they should already have a good idea of what the map and your presentation are going to be about.
📝 Pro tip: Store the inputs (questionnaire, coding rules) next to the chart. Meeting participants may ask for an actual survey question asked or a source of data to see the original number/response at any time.
And here is a quick graphical memo to remember:
Source: PlanIO
Using perceptual maps for brand strategy
Reviewing what the maps show can lead to celebration or frustration, but whichever the outcome, the story doesn’t end there, as the “mission” of perceptual map marketing is to act upon the results. Your brand will benefit from using the mapping exercise to improve your competitive positioning in the market.
How to interpret perceptual maps
First, ask yourself and your teammates what is meaningful to buyers. A competitive positioning diagram works when axes come from real customer language.
To that end, you need to understand the incentives, motives, pain points, and needs of your buyers. Collect this info during the interview/survey phase, or send follow-up emails to the selected respondents.
In perceptual mapping, reviewers must look not only at the actual numbers, but also at spacing and clusters. Gaps suggest opportunity; crowded zones warn of sameness.
A competitive scan tells you whether your position is clear enough to be chosen quickly. If not, simplify your product offerings, your brand storytelling, values, and mission. Any piece of communication contributes to the customer’s perception of your brand.
Repositioning strategies using maps – When and how to shift perception
Use perceptual map marketing as a reality check. If your desired position is far from today’s perception, decide what to change — and how long it will take. For that, develop a clear action plan and allocate responsibilities. Don’t forget about the timeline (deadlines).
Your brand story should be the shortest way to explain the real difference. Change the experience first, then update the words.
Here are five practical moves you can plot on the map to guide your brand’s next steps:
- Anchor around a strength customers already credit you for – Double down on what buyers already trust and recognize in you.
- Stretch to a nearby attribute with visible proof – Move slightly toward a valued quality and support it with evidence.
- Split offers, so each tier owns a clear spot – Differentiate product versions, so each one clearly fills a market role.
- Partner to add missing credibility quickly – Work with collaborators who already own attributes your brand lacks.
- Refocus on a sub-segment where you’re already preferred – Narrow attention to audiences where you already win trust consistently.
📌 Pro tip: After the implementation of your action plan, run additional pilots and re-plot the map. It takes time, but there is no alternative to a steady iterative approach with incremental steps. If the dot on an updated map doesn’t budge, revisit the claim or the experience supporting it.
A case study of perceptual map marketing
Let’s now review a case study that showcases the power of a positioning map. It’s about smartphone brands in Southeast Asia.
Who: A research group in Indonesia, working with ScienceDirect, looked at how people talk about smartphones in expert reviews.
The challenge faced: The market was saturated, with Apple, Samsung, and local players all competing for attention. While advertising tried to highlight differences, consumers often saw the brands as interchangeable.
The solution: By using a brand perception map, the team analyzed thousands of review texts and mapped brands according to attributes buyers cared about, such as design, reliability, and performance. The map showed Apple and Samsung positioned far apart in people’s minds, with mid-tier brands clustering together.
The results: The analysis revealed not just rivalry at the top, but also blind spots in the middle of the market. Mid-tier brands could see where their product-related promises overlapped too closely, and where they might carve out new ground.
Strategic benefits and limitations
If perceptual maps are so popular, there must be something special about them, such as outstanding benefits for individual and corporate brands. In this chapter, we’ll explore the key benefits, but will also look at some common limitations of positioning mapping to be aware of, as well as common mistakes to avoid.
Advantages of perceptual map marketing
A brand perception map helps teams see what customers already sense. It turns interviews, reviews, and data into a clear picture of the field. It’s easy to grasp, easy to discuss, and highly practical for strategic sessions involving key decision-makers from various corporate departments.
This pays off in competitive settings where incremental differences get lost. The simple truth is that the image on the wall (on a smart screen) shows whether you’re standing out or standing in line.
Without further ado, here are some concrete upsides you can expect:
- Immediate clarity — Complex findings and months of research shrink into a single view.
- Fewer dead-ends — A market positioning chart trims weak options early. It’s easy to see where you shouldn’t go and what the desired state is.
- Aligned execution — Product, marketing, finance, sales, IT, execs, and even support functions like HR move toward the same place.
- Portfolio guardrails — You make sure each product or service in your lineup occupies a unique, non-overlapping position, so premium and budget tiers don’t compete with or confuse each other.
- Decision narrative — Instead of guessing, all participants of the meeting can see the way forward, and you, as a facilitator, can explain the “why” behind a move in seconds.
For inspiration, check out these infographics with some other widely-cited benefits:
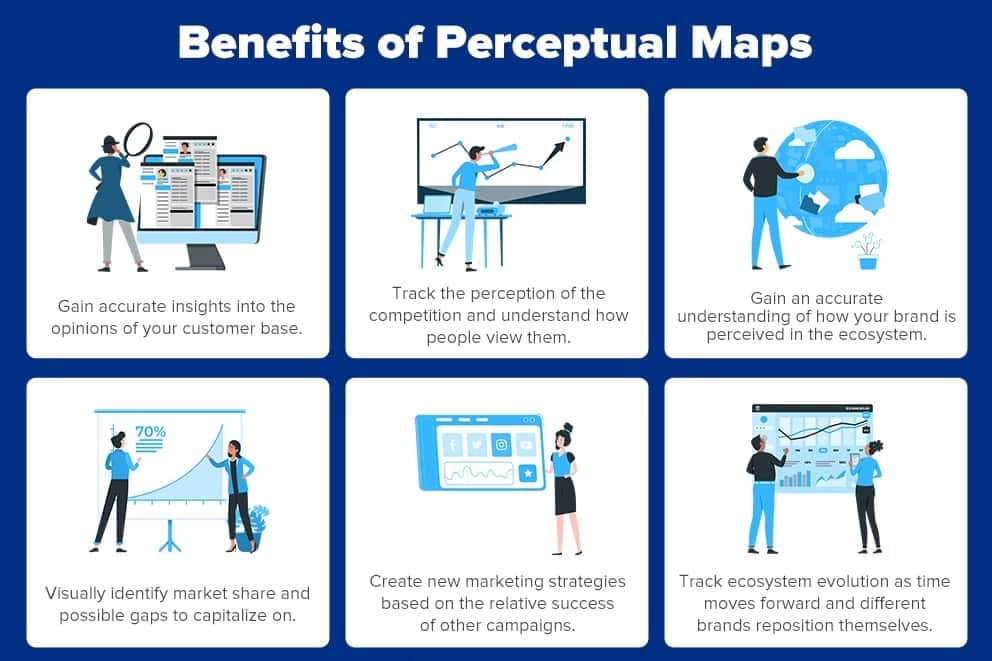
Source: Questionpro
The map won’t write your strategy, but it will anchor it. People rally faster when they can point at something specific. That shared picture often becomes a time-saver.
📝 To remember: The most significant outcome is that business decisions speed up because context is visible.
Limitations to be aware of
Despite all its advantages, in a brand positioning exercise, every map is a reduction. The truth is, two axes can’t carry the full story of preference and behavior.
Treat the perceptual map marketing as a hypothesis generator. Ideal for brainstorming sessions with key decision-makers, saving their time and yours. You should use it to frame questions, then test them in the real world.
That said, beware of the following limitations of perceptual mapping:
- Missing factors — It’s impossible to fit all customer perceptions on a single map; only the key factors like engagement, trust, loyalty, reliability, and others can be displayed.
- Static views — Modern markets, powered by AI technologies, change and fluctuate very rapidly, and a fixed snapshot on your map may quickly become outdated.
- Audience drift — Capturing the opinions of a portion of your audience doesn’t mean it fully represents the entirety of your customer base, nor audiences in separate markets.
- Pattern bias — Clean, organized shapes often trick observers into seeing purposeful structure within randomness.
- Capability ceiling — Looking at a map and envisaging the to-be state, it’s easy to overestimate your organizational and people capabilities required to achieve the desired future state.
Say these out loud before or during the meeting. It will help you keep the team grounded and reduce contradictions and surprises further down the road.
Used this way, the picture guides better experiments. It nudges you toward moves you can support with evidence.
Common mistakes to avoid
Mistakes are quite common, even for such a straightforward exercise as perceptual mapping. They happen at various stages of the process, and no one is guaranteed to avoid them. But when you know what they are and what damage they can cause, you’re far better equipped to prevent missteps early and keep your positioning decisions grounded in reality.
Always ask what is the buyer evaluating when they choose. If your axes don’t reflect that, a brand differentiation map creates false comfort.
Another trap is aiming at novelty rather than value. Perceptual map marketing is most useful when the destination matters to customers and suits your strengths.
Long story short, the following pitfalls are the most common; avoid them by all means:
- Wishful labels — When you label axes according to your corporate voice and values. Instead, use the same wording that is common to your customers to avoid misunderstanding and wrong interpretations.
- Empty-corner chasing — Make sure you explain what each quadrant on the map means, as oftentimes, teams chase a particular corner not fully understanding what it implies (and what it takes to achieve).
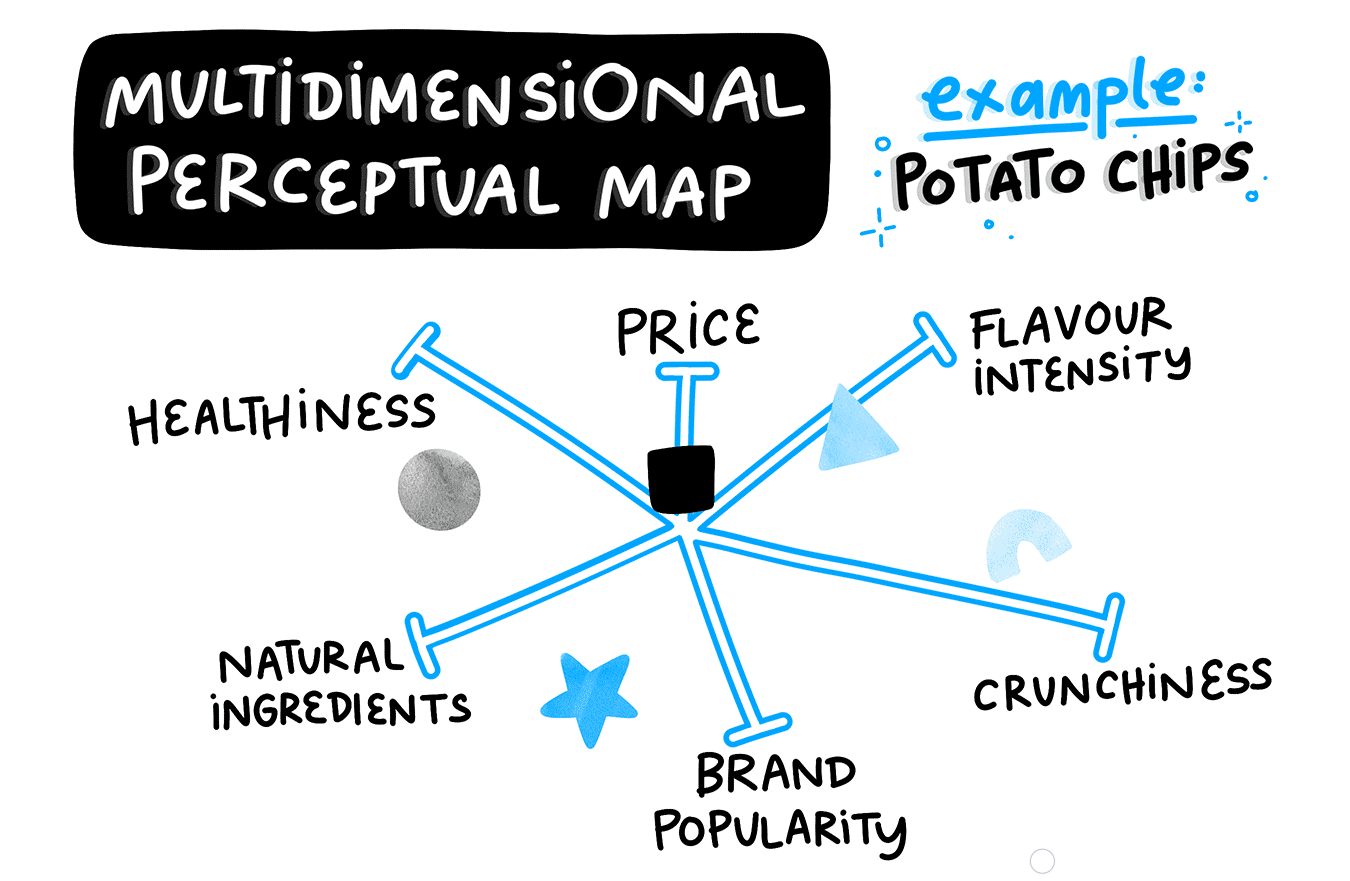
- Single-picture thinking — Sometimes, fitting all customer responses on a single map is not reasonable (although tempting). For example, you try to place brand loyalty and affordability on the same map. Better use several maps for deeper discussions.
- Words first — Avoid updating your slogans or messaging before the actual offer evolves. If the product or service stays the same, but the words change, customers will quickly notice the mismatch and lose trust. Always let real improvements lead the story, not the other way around.
- Overlooking trade-offs — When the team desperately moves toward one position on the map (the desired to-be state), they often overlook the connected trade-offs. For instance, chasing affordability as a competitive advantage, you may unintentionally hamper perceived quality. You don’t want to create confusion about the real essence of your company, don’t you?
📝 The bottom line: Handle the basics well, avoid the above-mentioned pitfalls, and your competitive positioning chart will bring the maximum return for your efforts.
Tools for perceptual map marketing and future trends
We live in a digital world, where smart boards have long replaced conventional drawing boards in classrooms and in offices. Preparing and presenting your perceptual map happens on a laptop, and the best part is that you don’t have to struggle alone; there are plenty of specialized tools that can help you with data collection, drawing, and presenting.
Even more so, the future of perceptual map marketing will bring even more convenience, autonomy, and speed. Wondering how? Check out this last part before we wrap up the discussion.
Digital tools for perceptual mapping
Good news upfront: you don’t need a stats lab to build a perceptual positioning map. All you need are clean inputs, sensible axes, and tools that make analysis and visuals painless. The stack below covers research, analysis, and presentation — end to end.
Start by deciding how you’ll collect perceptions. Interviews and surveys are fine, but reviews and support logs help, too.
Then choose analysis tools that can run basic similarity measures or multi-attribute scoring before you draw a market positioning chart. Utilize every bit of support you can find, even if it's just an automated email dissemination add-on to your Gmail with a questionnaire, or a template for drawing the map.
Here are 7 helpful tools (and where they shine):
- Qualtrics — Strong survey logic, panel sourcing, and built-in stats. Great when compliance and scale matter. Clean exports let analysts build a perceptual chart without wrestling messy schemas.
- SurveyMonkey — Quick survey builds, logic, and decent analytics. Good for fast pulses when you’re validating axes or checking competitive spacing. Exports clean CSVs for deeper analysis in R, Python, or SPSS before drafting a perceptual chart.
- Typeform — Conversational surveys that reduce drop-off for open-ended questions. Useful when you want buyer language to name axes. Webhooks make it simple to send data to Sheets or a notebook before plotting a competitive positioning diagram.
- Google Forms + Sheets — Free, fast, and collaborative. Great for early tests of attribute lists and similarity scoring. With a few formulas (or AppScript), you can transform responses into coordinates for a lightweight market positioning chart.
- Tableau — Drag-and-drop dashboards for interactive maps. Add filters for segment, region, or time to see positions move. Executives love clicking through a market positioning chart without touching the data layer.
- Miro (or Figma) — Collaborative canvases to finalize the story. Drop exported points, annotate clusters, and workshop names for quadrants. Useful for polishing the perceptual positioning map into slides that everyone actually understands.
- Python (pandas + scikit-learn) — Best for blending survey data with qualitative sources (reviews, tickets). Vectorize text, cluster, and transform features into axis scores before rendering a perceptual chart.
Source: SurveyMonkey
📌 Pro tip: Start small, i.e., choose one “gather,” one “analyze,” and one “communicate” tool. Later, and at any stage of your work, you can always add complexity and add more tools.
A snapshot of the future of perceptual map marketing
The next wave will be less about beautiful dots and more about living maps. Teams will pair survey data with behavioral signals, so positions reflect what people say and what they do.
You’ll also see closer ties between the map and activation. When the brand shifts a message or feature, the system will replot positions and flag risks automatically. That’s where perceptual map marketing is heading.
The impact of AI & autonomous AI agents
AI already helps with the boring parts that cause errors: cleaning text, normalizing scales, and spotting contradictions.
Previously, open-ended questions in surveys were a headache for survey managers. Reading and analyzing them took days, if not weeks.
However, today, AI can do the same work in minutes. It analyzes thousands of respondents’ comments, suggests relevant names for the map’s axes, and even draws the map.
That automation alone improves the quality of your mapping process. It does take some supervision from the experienced process owner, but in the near future, we expect the whole process to be fully autonomous.
Autonomous AI agents will be able to run comparative “mystery shopping” across sites or apps. They’ll document friction in sign-up, support, and pricing flows, then score attributes that matter to your map. You’ll see not only where you sit, but what’s pushing you there.
Expect agent-driven suggestions like:
- “Defend simplicity: ship an onboarding fix and shorten the claim.”
- “Differentiate support: publish guaranteed response times with evidence.”
- “Reposition to offer more value: introduce a focused tier with fewer features.”
AI won’t take the strategy process away from you, but it will give you a clearer, faster starting point and will free your time to focus on other, more important (strategic) things.
Real-time consumer insights
Real-time inputs turn a static picture into a living, competitive positioning diagram. Search intent shifts, product telemetry, and customer service themes will flow into a dashboard so you can see perception drift before it becomes a problem.
Here is a quick snapshot of some of the practical outputs you’ll use:
- Segment toggles to compare regions, industries, or cohorts.
- Early warnings when a competitor encroaches on your space.
- Links from dots to “evidence cards” showing the raw quotes or events.
In this informational overload, the risk is overreacting to noise and failing to prioritize what’s really important. To mitigate these risks, build thresholds and cooling-off rules so the market positioning chart changes only when signals persist.
Data-driven positioning
Better data doesn’t mean more axes; it means better axes. You’ll derive dimensions from the language and behavior that actually predict choice, not what’s convenient to measure. Feature uptake, time-to-value, and friction indicators will join perception data to validate a move.
Some good patterns to emulate:
- Derive axes from variables with predictive power, not convenience.
- Use controlled trials to validate whether a proposed move changes behavior.
- Keep a short “proof library” for each position: feature, metric, and story.
Do this continuously, and perceptual map marketing becomes a dependable way to plan change, not just present it.
📝 Two final thoughts. First, clarity scales; the simpler your axes, the easier they travel. Second, link every message to a real, visible change customers notice right away.
Conclusion
Perceptual map marketing is an effective and highly affordable tool for brand positioning. It implies collecting customer inputs, analyzing them, plotting everything on an easy-to-read map, and conducting a strategic session with the key decision-makers to understand the as-is and plan the to-be state of brand (product, service) perception.
This process also helps to understand the competitive stand, i.e., where your brand is compared to the key rivals. Provided you’ve questioned your customers about your competitors’ brands.
The key recommendation with perceptual mapping is to keep things simple: ask fewer, but sharper questions, employ digital tools to automate the process, analyze customer feedback (particularly, the open-ended comments), and make several maps if you need to display different categories (e.g., simplicity and perceived value, affordability and reliability).
The future of the brand differentiation map will be heavily influenced by AI and the enhanced autonomy it will bring. Within a few years, you’re likely to see “live” perceptual maps that change according to customer behavior and feedback taken on the fly, as customers shop online and make choices.
Your gains from these technologies will largely depend on your organizational and people capabilities, which you must build already today to stay competitive.
FAQ
What is a perceptual map in marketing?
A perceptual map is a graphic representation of consumer psychology relative to your competitors. It plots how your consumers perceive your brand or its products relative to competitor brands and products. The graph uses two dimensions. Some usual combinations include price and quality, simplicity and utility, and convenience and functionality.
How to make a perceptual map in marketing?
To make a perceptual map, you cannot just rely on your intuition or opinion. You must use real customer data collected in advance through surveys and research. You also need to use a visual tool of your choice, e.g., Google Sheets (the simplest), or digital whiteboards and graphics software like Figjam, Mural, Mira, or Canva.
What are the 4 stages of the perceptual process?
People go through these 4 perceptual stages to filter, organize, and make sense of the stimuli around us: exposure, attention, interpretation, and retention (memorizing). This framework is widely used and carefully studied in consumer psychology and behavior by marketers and business owners.
All trademarks, logos, images, and materials are the property of their respective rights holders.
They are used solely for informational, analytical, and review purposes in accordance with applicable copyright law.